Community articles — Reports
Write up experiments and research with LaTeX templates for project and lab reports—including layout guidelines to help guide you through the writing process.
Recent
Se calculó la eficiencia real y de Carnot de un Aparato de Eficiencia Térmica (Model TD-8564).
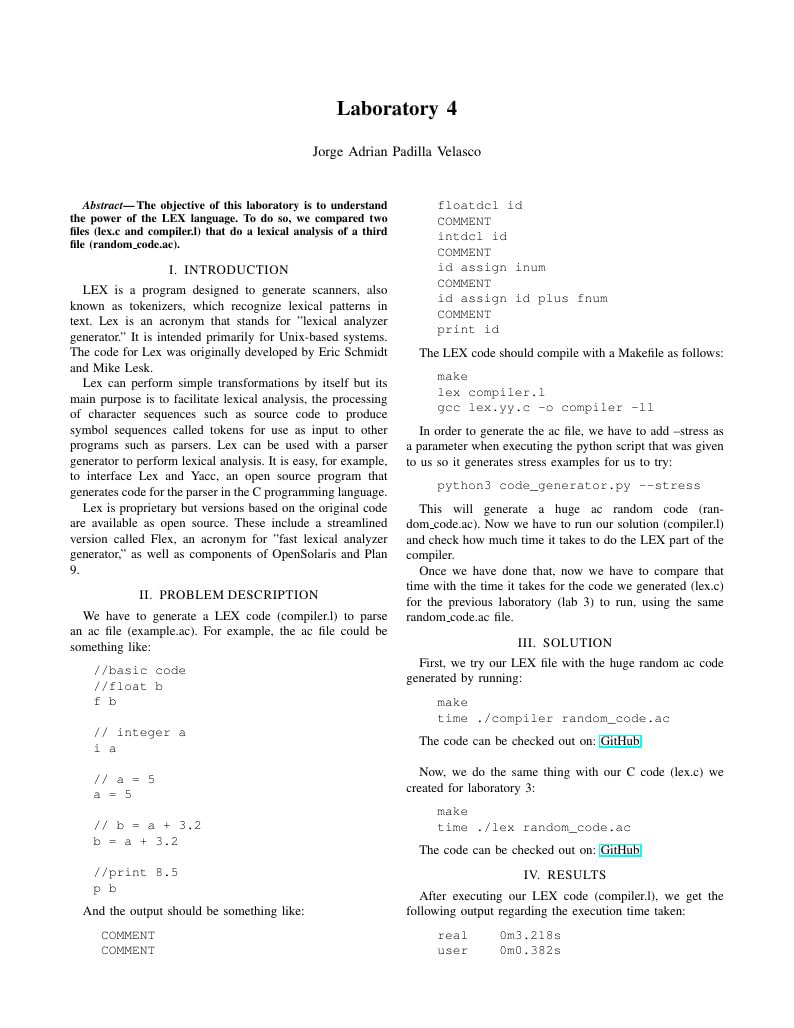
Laboratory where LEX is compared to C
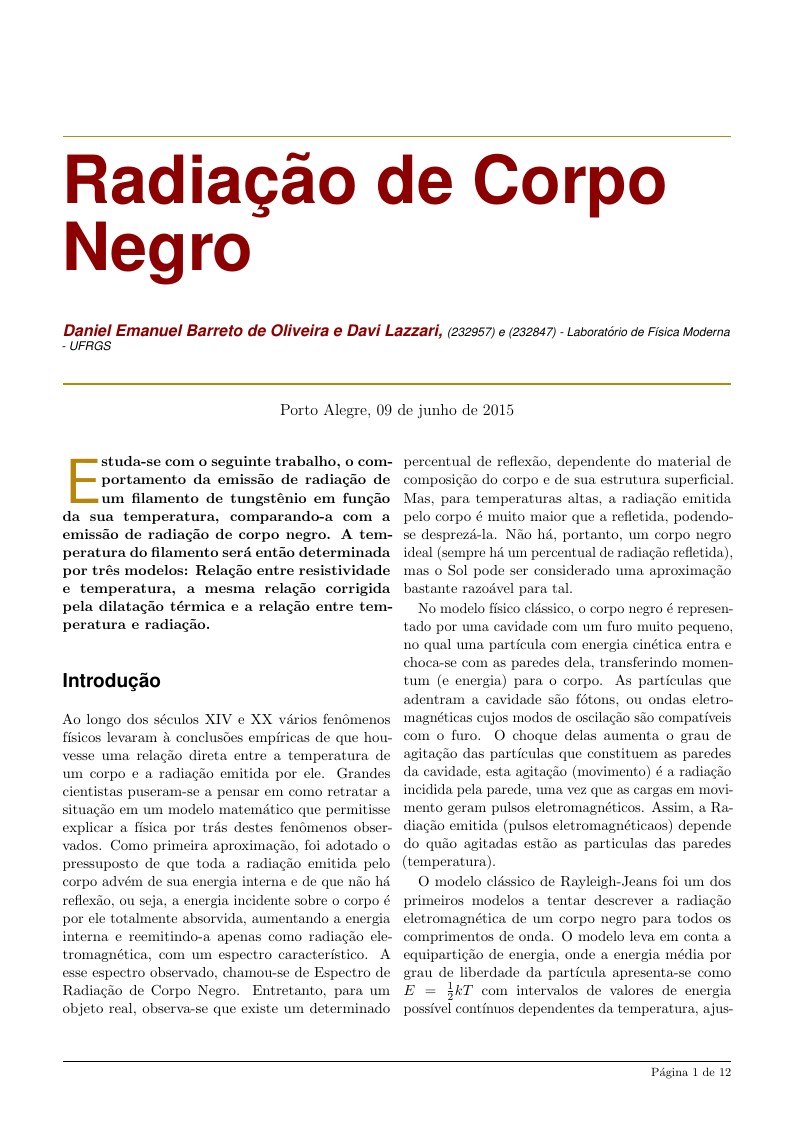
Trabalho experimental de determinação da Constante de Planck e do comportamento de Corpo Negro para um filamento de Tungstênio a partir da determinação de temperatura por resistência e por radiação eletromagnética.
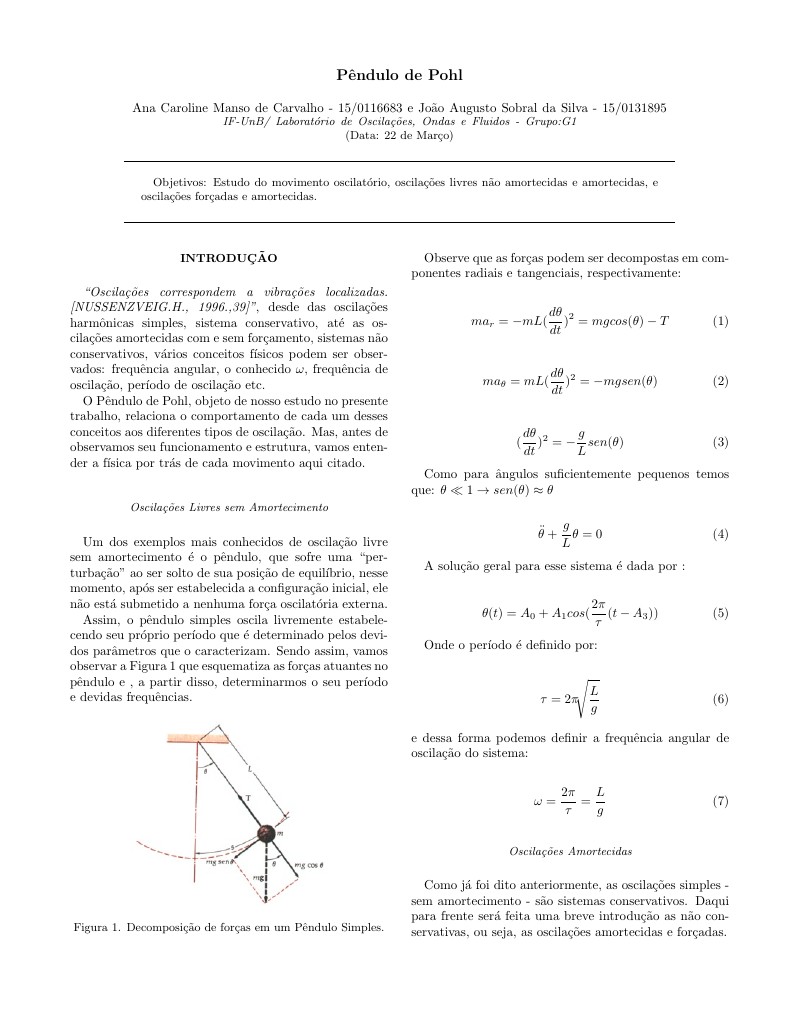
Objetivos: Estudo do movimento oscilatório, oscilações livres não amortecidas e amortecidas, e oscilações forçadas e amortecidas.
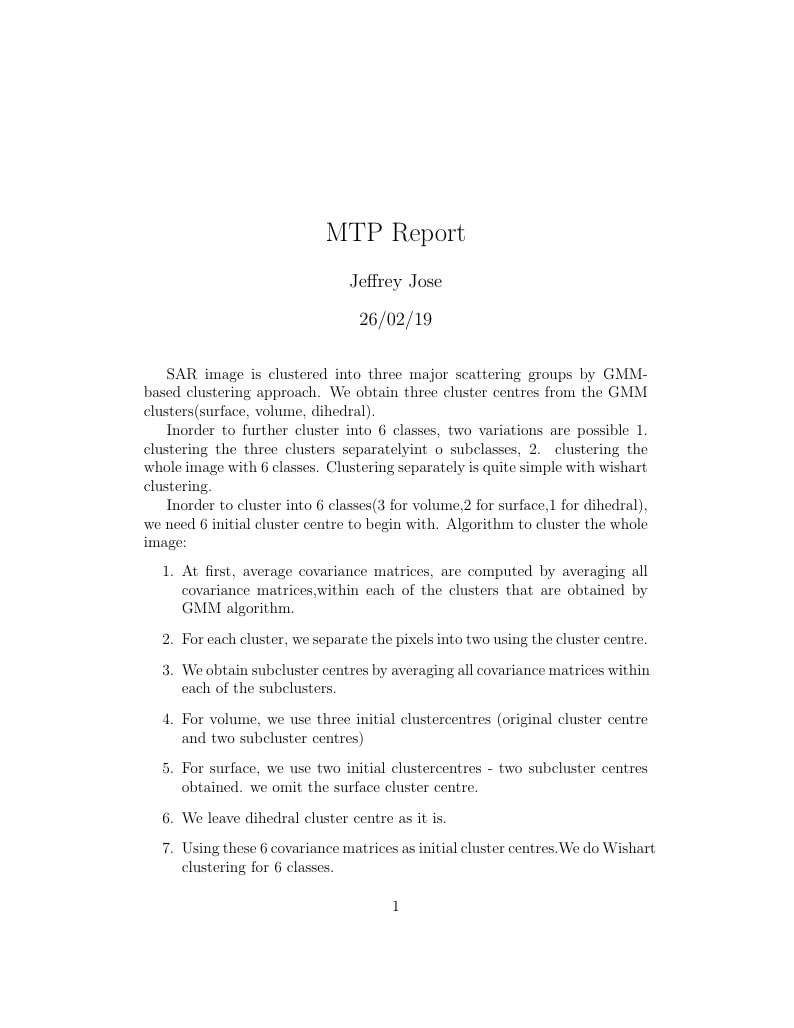
SAR image clustering
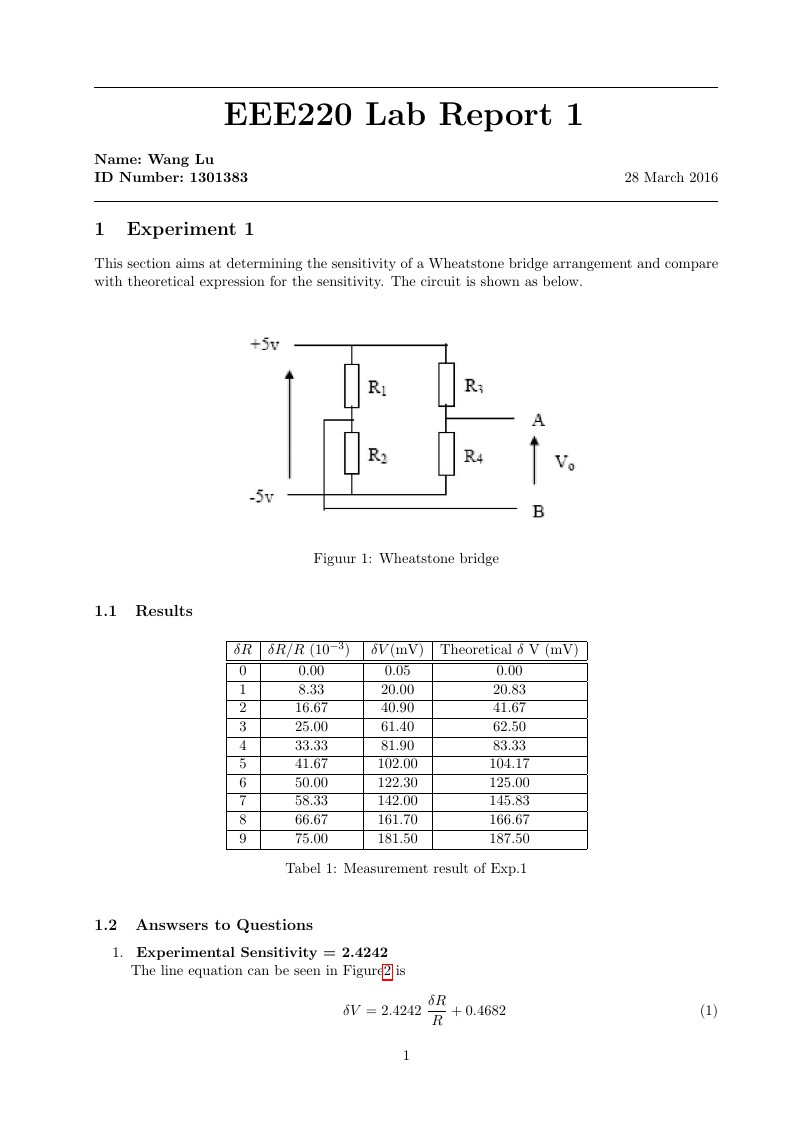
This is a simple lab report version about strain gauge, which contains graphs, tables, and formula.
Prática 9 de Tópicos de Física - CEFET
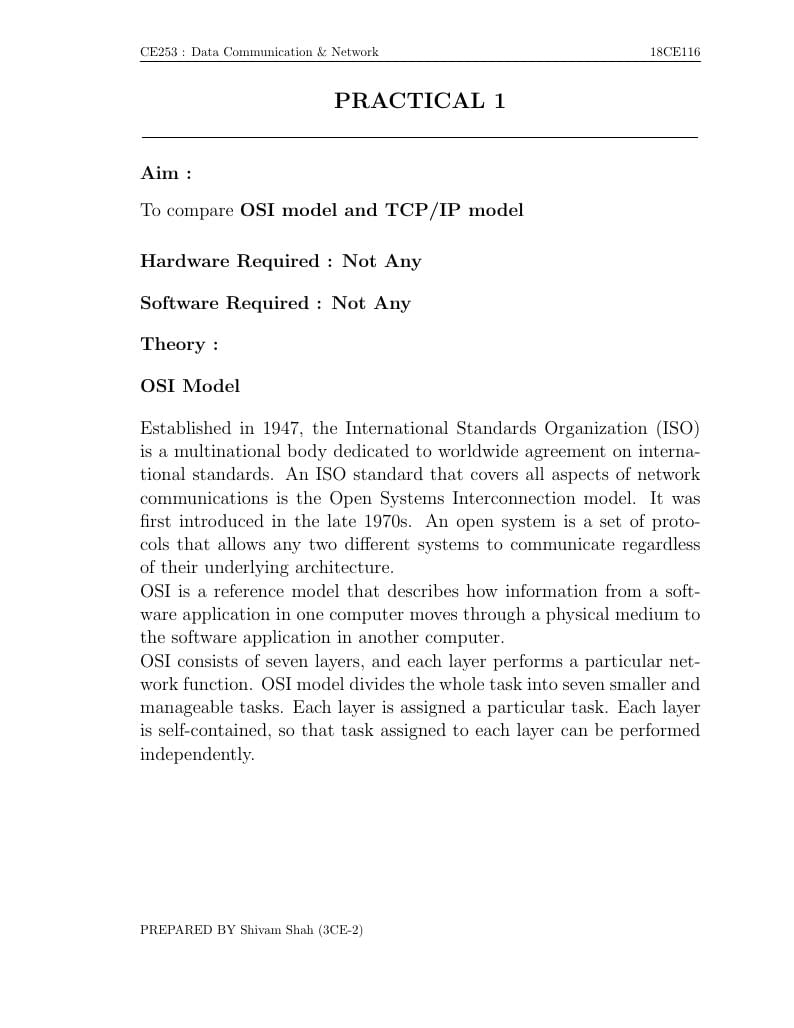
A short description about the OSI model and TCP/IP model.
The purpose of this lab is to determine the spring constant of a given spring. This spring constant is given by the relation between the force exerted on the spring and the distance the spring is either stretched or compressed. This relationship is given through Hooke’s law which we are going to get a better understanding of throughout this lab.
Related Tags
- Portuguese
- Purdue University
- Handout
- Bosnian
- International Languages
- Math
- References
- University
- Algorithm
- Biber
- BibLaTeX
- Tables
- Czech
- Dynamic Figures
- Quiz, Test, Exam
- Conference Paper
- Electronics
- Harvard University
- Tutorial
- Physics
- Source Code Listing
- Swedish
- French
- Portuguese (Brazilian)
- Greek
- Springer
- Getting Started
- Research Diary
- Essay
- Exam
- Title Page
- Elsevier
- Spanish
- German
- Radboud University
- LuaLaTeX
- Brochure
- Université d'Avignon
- Geophysics
- Università di Bologna
- Newsletters
- Posters
- CVs and résumés
- Formal letters
- Assignments
- Cambridge University
- Instituto Federal de Educação Ciência e Tecnologia (IFCE)
- Imperial College London
- Korean
- Norwegian
- Polish
- University of Bergen
- Bristol University
- XeLaTeX
- Arabic
- University of Sarajevo
- SEGTeX
- MATLAB
- Grant Application
- Two-column
- Umeå University
- Queen Mary University of London
- Zagazig University
- University of Helsinki
- University of Copenhagen
- Reykjavík University
- University of Reading
- Universidad Nacional Autónoma de México
- University of Cape Town
- The Hudson School
- Peking University
- Universidad de Costa Rica
- Books
- Presentations
- Theses
- Japanese
- Tilburg University
- Universidade Tecnológica Federal do Paraná (UTFPR)
- IEEE (all)
- IEEE Community Templates and Examples
- Cologne University of Applied Sciences (Fachhochschule Köln)
- Chemistry
- University of Manchester
- Universidade Federal do Rio Grande do Sul
- Vietnamese
- Stanford University
- Chinese
- Thai
- Universidade de Lisboa
- New York University (NYU)
- Pontifícia Universidade Católica de Minas Gerais (PUC)
- Evaluation
- Indian Institute of Technology Madras
- Universidade de São Paulo
- Uppsala University
- Geology
- Wright State University
- Catalan
- Kiel University of Applied Sciences
- University of Porto
- University of Tennessee
- Malcolm X Shabazz High School
- Pocono Environmental Education Center
- Hebrew
- University of California, San Diego
- Universitat Rovira i Virgili
- Pontificia Universidad Católica de Chile
- Meeting Minutes
- Russian
- Moscow Aviation Institute
- Research Proposal
- Universidad Tecnológica de Bolívar
- Technische Universität Berlin
- Universidad de Santiago de Chile
- Lecture Notes
- Aalborg University
- Dutch
- University of Birmingham
- University of Amsterdam
- Instituto Superior de Engenharia de Lisboa (ISEL)
- Université de Sherbrooke
- University of California, Berkeley
- University of Louisiana at Lafayette
- KTH Royal Institute of Technology
- Dr BR Ambedkar National Institute of Technology Jalandhar
- University of Redlands
- Universidade do Estado do Rio de Janeiro
- Icelandic
- Universidade Federal de Ouro Preto
- Astronomy & Astrophysics
- abnTeX
- Cornell University
- Lund University
- California Institute of Technology (Caltech)
- University of York
- Katholieke Universiteit Leuven (KU Leuven)
- Universidade Federal Rural de Pernambuco
- CERN
- Vanderbilt Biostatistics
- HIET Hamdard University
- Humanities
- Centro Brasileiro de Pesquisas Físicas
- Universidad de Sevilla
- University of California, Davis
- Bahasa Indonesia
- University of Strathclyde
- Universidade Estadual de Feira de Santana
- Turkish
- Universidade Federal de Santa Catarina
- Tecnológico Nacional de México
- American Psychological Association
- Universidade Federal de Goiás
- TU Delft
- University of Ljubljana
- German University in Cairo
- Instituto Superior de Engenharia do Porto
- Linköpings Universitet
- Ukrainian
- Observatório Nacional
- Université Laval
- Universidade do Vale do Rio dos Sinos
- Kocaeli Üniversitesi
- AGH University of Science and Technology
- University of Twente
- Universidad de Chile
- Universidade de Brasília (UnB)
- Unidad de Formación Masiva
- Birla Institute of Technology and Science
- Universidad Tecnológica Nacional
- Universidade Federal do Rio de Janeiro
- Swiss Federal Institute of Technology in Zurich (ETH Zürich)
- Modern Language Association (MLA)
- Chicago
- Universidade Federal da Paraíba (UFPB)
- Politecnico di Milano
- IES San Mateo
- Universidade Federal do Rio Grande do Norte (UFRN)
- INSA
- Universidad La Salle (Mexico)
- Universidade Federal de Santa Maria
- Senter for klinisk dokumentasjon og evaluering (SKDE)
- Universidad Zaragoza
- Universidade Federal do Piauí (UFPI)
- Faculdade do Piauí (FAPI)
- Queen's University, Canada
- Centro Federal de Educação Tecnológica de Minas Gerais (CEFET-MG)
- University of Nottingham
- Fundação de Amparo à pesquisa do Estado de São Paulo (FAPESP)
- Hungarian
- University of Pretoria
- Italian
- University of Iceland
- Nanyang Technological University
- University of Florida
- Instituto Nacional de Pesquisas Espaciais
- University of Western Australia
- Turabian
- Universidade Federal de Uberlândia (UFU)
- University College London
- Eindhoven University of Technology (TU/e)
- Escola Politécnica da USP
- Universidade Estadual de Campinas (UNICAMP)
- STEM Fellowship
- Universidade Federal de Lavras
- Universidad Central
- TU Dresden
- Massey University
- CECyTE
- Xi'an Jiaotong University
- Heilig Hart van Maria, Berlaar
- Instituto Federal de Educação, Ciência e Tecnologia da Bahia
- Boston University
- Universidad Autónoma de Nuevo León
- University of Michigan
- AENEAS
- Universidade Federal de Minas Gerais (UFMG)
- Farsi (Persian)
- Northwestern Polytechnical University, China (西北工业大学)
- Vrije Universiteit Brussel (VUB)
- Universidad Autónoma de San Luis Potosí (UASLP)
- Universidad Autónoma de Chile
- University of Waterloo
- Harbin Institute of Technology
- Università degli studi di Napoli Federico II
- University of Warwick
- Universiti Tunku Abdul Rahman (UTAR)
- KEA Copenhagen School of Design and Technology
- University of Edinburgh
- University of Leeds
- Universidade Federal de Alagoas (UFAL)
- Indiana University – Purdue University Fort Wayne
- Universidad de Guadalajara
- Games
- University of Malta
- Iran University of Science and Technology (IUST)
- University of New South Wales
- Oregon State University
- University of Passau
- Università di Pisa
- Universidade da Coruña (UDC)
- Trinity College Dublin
- University College Dublin
- Instituto Tecnológico Vale
- Universidad de Oviedo
- Maastricht University
- Instituto Modal
- University of Southampton
- UPV/EHU
- Aveiro University
- Singapore University of Technology and Design (SUTD)
- FH Aachen
- Universidad Industrial de Santander (UIS)
- University of Innsbruck
- Universitat de Lleida
- Instituto Federal de São Paulo
- TU Darmstadt
- Universidad Católica Boliviana "San Pablo"
- Universidad Cooperativa de Colombia
- Universita' degli Studi di Messina
- Luleå University of Technology
- Università degli Studi di Trento
- Universidad de Tarapaca
- Instituto Tecnológico de Buenos Aires
- Software Engineering
- Universidade Federal do Ceará
- Universidade Federal de Pernambuco (UFPE)
- Ohio State University
- Universidad Nacional de San Agustín
- Technical University of Munich
- Pontifícia Universidade Católica do Rio de Janeiro
- Hasso-Plattner Institute
- University of Würzburg
- Ho Chi Minh City University of Technology
- Friedrich-Alexander University Erlangen-Nürnberg
- University of Agder
- Purdue University Fort Wayne
- Memo
- University of Sydney
- Australian Mathematical Sciences Institute
- University of Oslo
- Carmelcollege Emmen
- University of Sheffield
- Huazhong University of Science and Technology
- Universidad Autónoma de Ciudad Juárez
- Universidad Distrital Francisco José de Caldas
- Beijing Institute of Technology
- Washington State University
- Technical University of Denmark
- Erciyes University
- Universidade Federal de Mato Grosso
- Okinawa Institute of Science and Technology
- University of Glasgow
- Jordan University of Science and Technology
- Copenhagen Center for Health Technology
- Iowa State University
- University of Keele
- Zhejiang University
- Universidade Federal do Paraná
- University of Groningen
- University of Liverpool
- École de Commerce et École de Culture générale de Martigny
- Latvian
- Czech University of Life Sciences
- University of L'Aquila
- University of Delaware
- University of Melbourne
- École Centrale de Lyon
- Universidade Federal dos Vales do Jequitinhonha e Mucuri
- École Polytechnique Fédérale de Lausanne
- Charité – Universitätsmedizin Berlin
- National Institute of Standards and Technology
- University of Lincoln
- Brno University of Technology
- Universität Duisburg-Essen
- Instituto Nacional de Telecomunicações (INATEL)
- University of Cuenca
- Universidad de las Fuerzas Armadas ESPE
- Northeastern University
- Universitat Politècnica de València
- Universidad Tecnológica de Pereira
- University of Information Technology (Vietnam)
- University of Bremen
- Shanghai Jiao Tong University
- SINTEF
- Marmara University
- Warsaw University of Technology
- National College of Ireland
- University of Alberta
- Peter the Great St.Petersburg Polytechnic University
- Universidad Autónoma de Zacatecas
- Universiti Teknologi MARA (UiTM)
- Norwegian University of Science and Technology
- ARPA-FVG
- Manchester Metropolitan University
- ENET'Com
- Pontifical Catholic University of São Paulo
- Sheffield Hallam University
- Universidade Federal de São Paulo
- ICONTEC
- Instituto Plurilingüe Rosalia de Castro
- University of Surrey
- Escola Superior de Tecnologia e Gestão
- Cyprus University of Technology
- Tecnológico de Monterrey
- Karlsruhe Institute of Technology
- Università degli Studi di Salerno
- Universidade da Coruña
- Linguistics
- Mid Sweden University
- University of Macau
- University of Chinese Academy of Sciences
- Jagiellonian University
- Centro Federal de Educação Tecnológica de Rio de Janeiro (CEFET-RJ)
- Edinburgh Napier University
- Universidad Nacional de Ingeniería
- Colorado School of Mine
- Stony Brook University
- Università di Padova
- Universidade Federal de Pelotas
- Mälardalen University
- Indian Institute of Management Indore
- Universidad Internacional de Valencia
- Universidade Federal do Amazonas
- Institut de physique du globe de Paris
- Universidade Federal do Maranhão
- Universidad de Buenos Aires
- Yıldız Teknik Üniversitesi
- Coventry University
- Universidad Nacional Pedro Ruiz Gallo
- Soochow University
- National Sun Yat-sen University
- Ain Shams University
- Brunel University
- Universidad Politécnica de Madrid
- University of Tsukuba
- APJ Abdul Kalam Technological University
- Universiti Teknikal Malaysia Melaka
- Saarland University
- Instituto Politécnico Nacional
- ENS Lyon
- University of Windsor
- King Abdullah University of Science and Technology
- University of Thessaly
- Université de Lille
- IIT Patna
- Somaiya Vidyavihar University
- Hunan University
- Makerere University
- Bulgarian
- Federal University of Viçosa
- Telkom Universuty
- Journal of Electrical Bioimpedance
- ITMO University
- Beijing Forestry University
- UNIVERSIDADE ESTADUAL VALE DO ACARAÚ
- University of Fribourg
- Universidade Federal do Recôncavo da Bahia
- University of Engineering & Technology Lahore
- University of Cantabria
- Vrije Universiteit Amsterdam
- Universidad ECCI
- Anna University
- Hong Kong University of Science and Technology
- University of Djelfa
- Université Paris Cité
- Université libre de Bruxelles (ULB)
- Galician
- Journal articles
- 2026 Conference
\begin
Discover why over 25 million people worldwide trust Overleaf with their work.