Recent
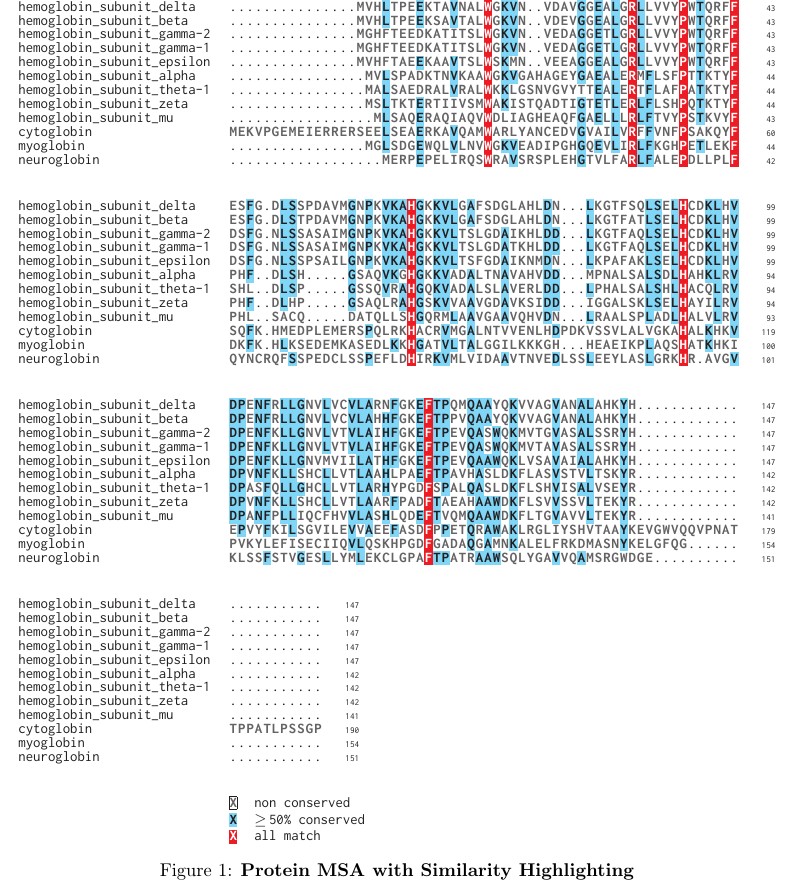
This template is used to create standalone, publication-quality figures for multiple sequence alignments using the texshade package.
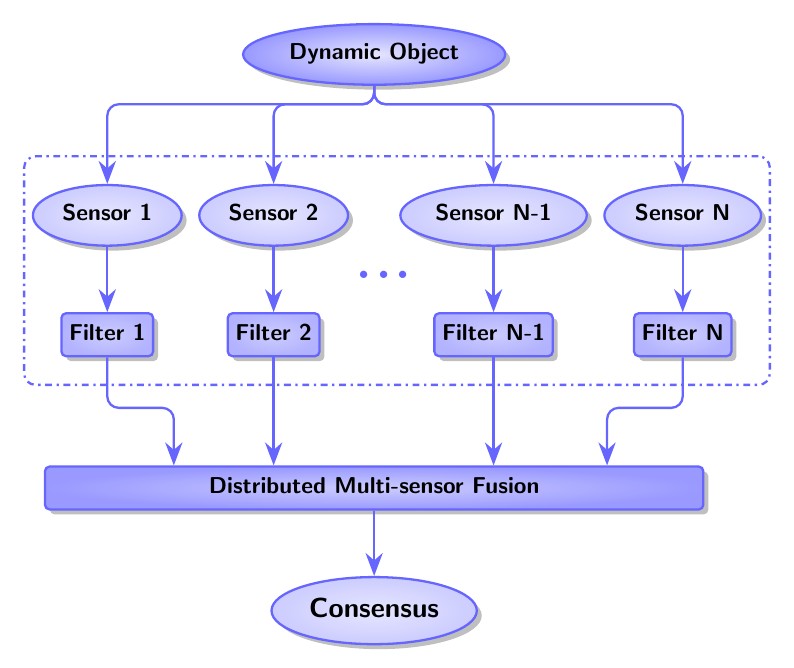
The output of this graph is used as Figure 1 of the paper: Wangyan Li, Zidong Wang, Guoliang Wei, Lifeng Ma, Jun Hu, and Derui Ding, “A Survey on Multisensor Fusion and Consensus Filtering for Sensor Networks,” Discrete Dynamics in Nature and Society, vol. 2015, Article ID 683701, 12 pages, 2015. doi:10.1155/2015/683701. It's based on http://www.texample.net/tikz/examples/hierarchical-diagram/. Relevant link: http://tex.stackexchange.com/questions/226461/how-to-draw-hierarchical-graph-like-this-one.
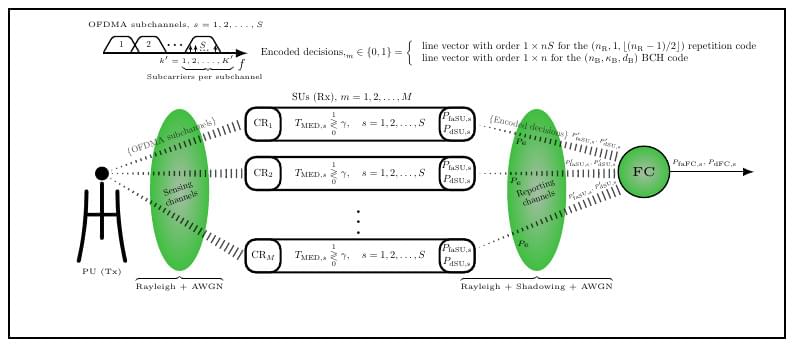
Centralized decision fusion CSS of OFDMA subchannels
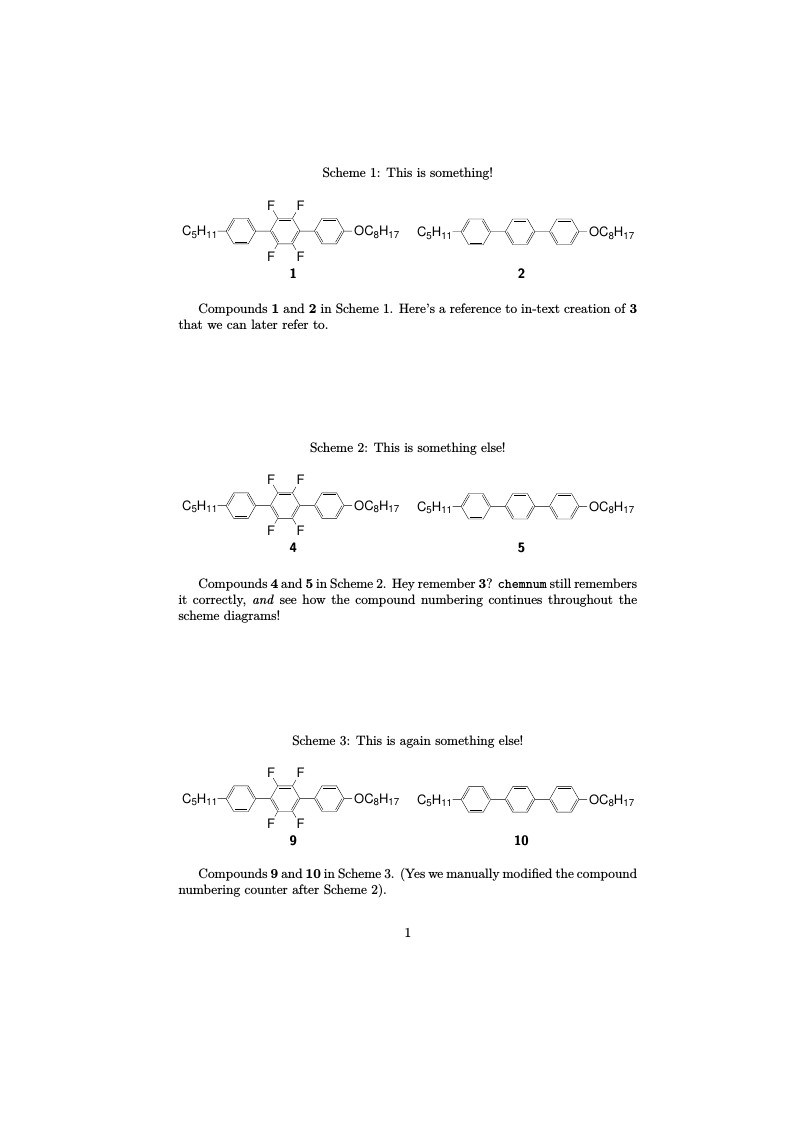
This example demonstrates how the chemnum package can be used to automatically number compounds in reaction schemes created with ChemDraw (saved as .eps files). While the chemstyle/chemscheme package can also be used, its author recommends the use of chemnum as it's deemed to be clearer. Ideally, the ChemDraw-generated .eps files should contain "TMP1", "TMP2" etc as temporary markers, which will then be replaced with automatically incrementing compound counters using the \replacecmpd command. Set your Overleaf project's compiler to be LaTeX (required for .eps images) when using this method.
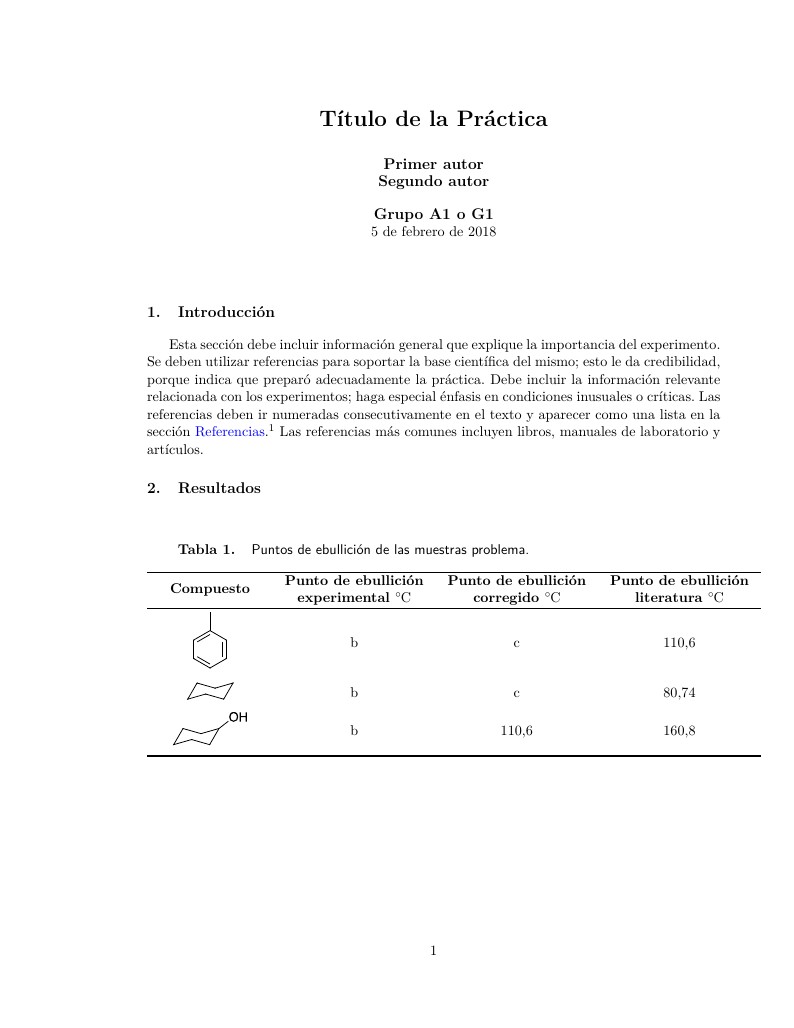
Plantilla para escribir los informes de Química Orgánica I

An example of the graphviz package, which uses dot in the background to draw graphs. Add \usepackage[pdf]{graphicx} to get HTML-like labels working.
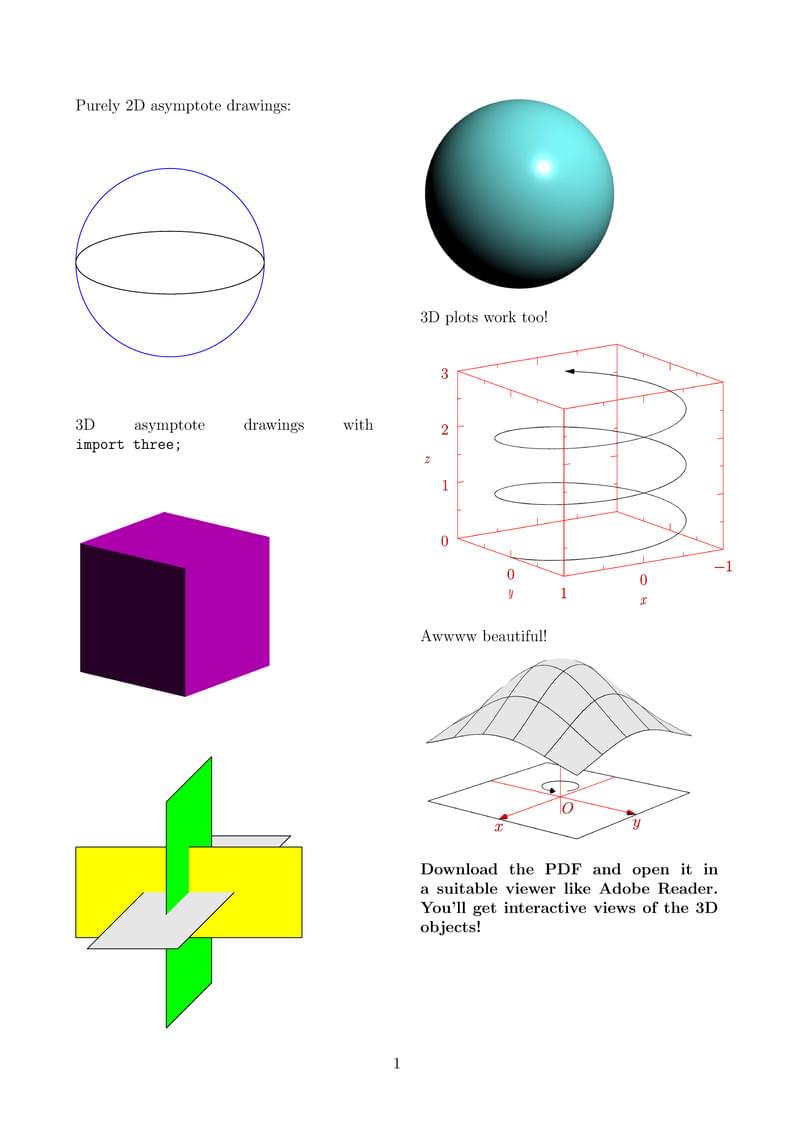
This example shows how to get asymptote 3D drawings working on Overleaf. All the drawings in this example were taken from the Asymptote documentation. If you download the PDF and open it in Adobe Reader, you'll get interactive views of the 3D objects!
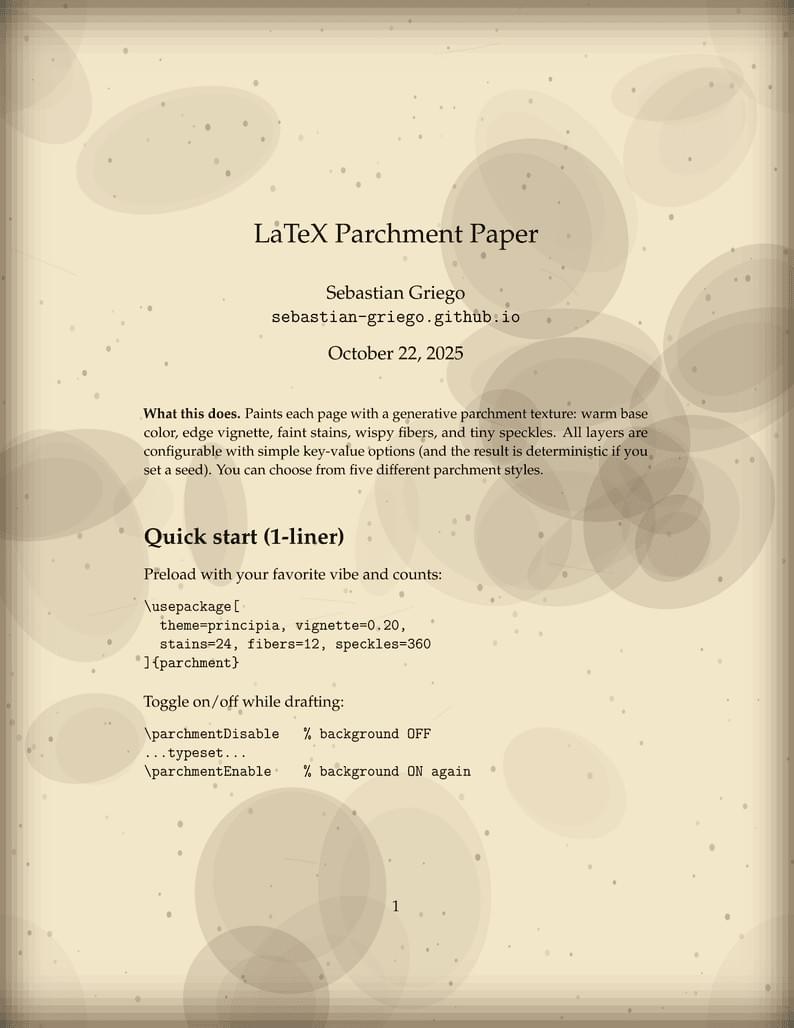
This package paints each page with a generative parchment texture. It adds a warm base color, edge vignette, faint stains, wispy fibers, and tiny speckles. You can choose from five different parchment styles.
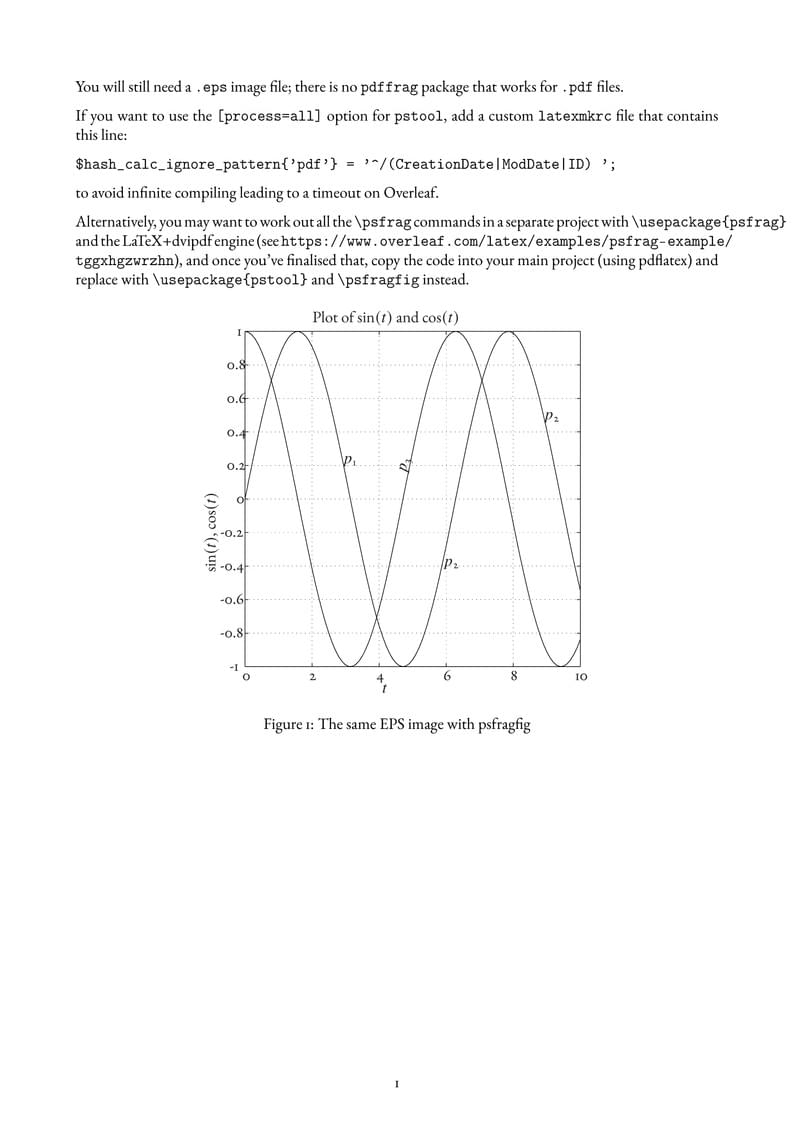
An example using the pstool package to get \psfrag commands working with .eps images in pdflatex.
\begin
Discover why over 25 million people worldwide trust Overleaf with their work.