overleaf template galleryCommunity articles — Recent
Papers, presentations, reports and more, written in LaTeX and published by our community.
The following slides were presented today (Thu 30 June 2016) in front of lecturers/researchers of Dept. Magister Management and Business, Faculty of Economics and Business, Universitas Padjadjaran, Indonesia.
Template for honours theses
The aim of this thesis is to investigate the ability of cardiovascular biomarkers calculated from peripheral pulse waveforms to estimate central properties of the cardiovascular system (e.g. aortic stiffness) using nonlinear one-dimensional (1-D) modelling of pulse wave propagation in the arterial network. To test these biomarkers, I have produced novel 1-D models of pulse wave propagation under normal and pathological conditions. In the first part of my thesis, I extended the modelling capabilities of the existing 1-D/0-D code to represent arterial blood flow under diabetes, hypertension, and combined diabetes and hypertension. Cardiac and vascular parameters of the 1-D model were tailored to best match data available in the literature to produce generalised hypertensive, diabetic, and combined diabetic and hypertensive population models. Using these models, I have shown that the pulse waveform at the finger is strongly affected by the aortic flow wave and the muscular artery stiffness and diameter. Furthermore the peak to peak time measured from the pulse waveform at the finger can identify hypertensive from diabetic patients. In the second part, I developed a new methodology for optimising the number of arterial segments in 1-D modelling required to simulate precisely the blood pressure and flow waveforms at an arbitrary arterial location. This is achieved by systematically lumping peripheral 1-D model branches into 0-D models that preserve the net resistance and total compliance of the original model. The methodology is important to simplify the computational domain while maintaining the precision of the numerical predictions — an important step to translate 1-D modelling to the clinic. This thesis provides novel computational tools of blood flow modelling and waveform analysis for the design, development and testing of pulse wave biomarkers. These tools may help bridge the gap between clinical and computational approaches.
Trabalho apresentado ao currículo da Disciplina de Programação de Computadores 2
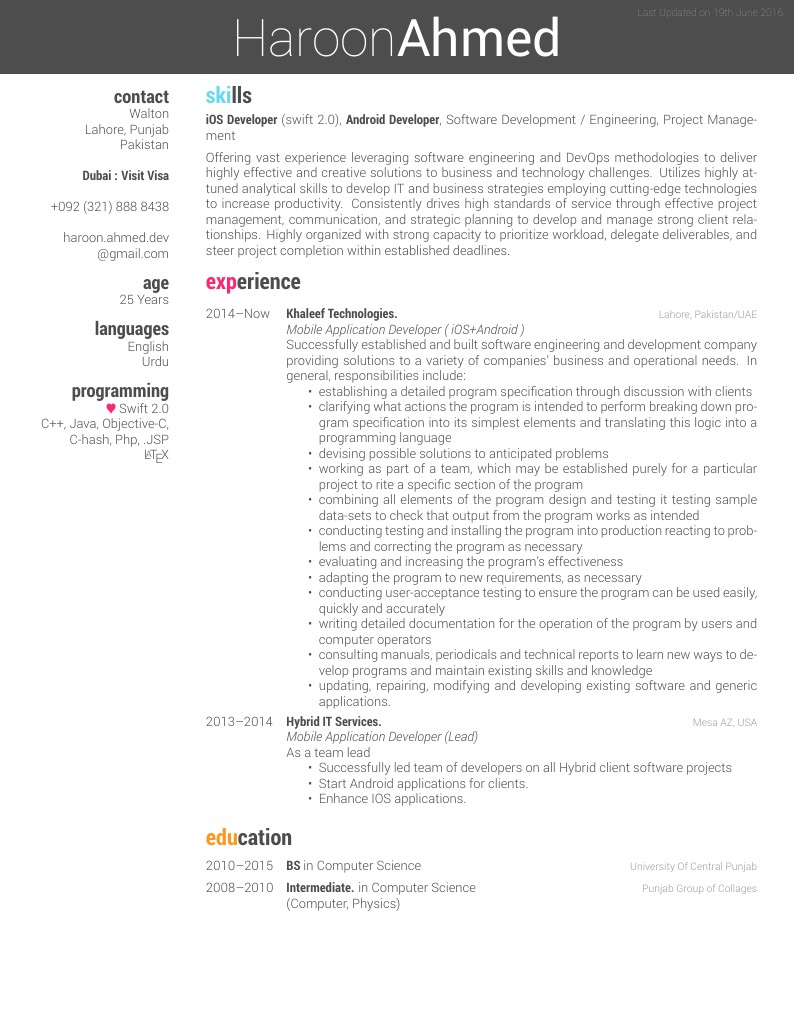
Haroon Ahmed's CV

A quick explanation of why the Alexander polynomial is an invariant for knots.
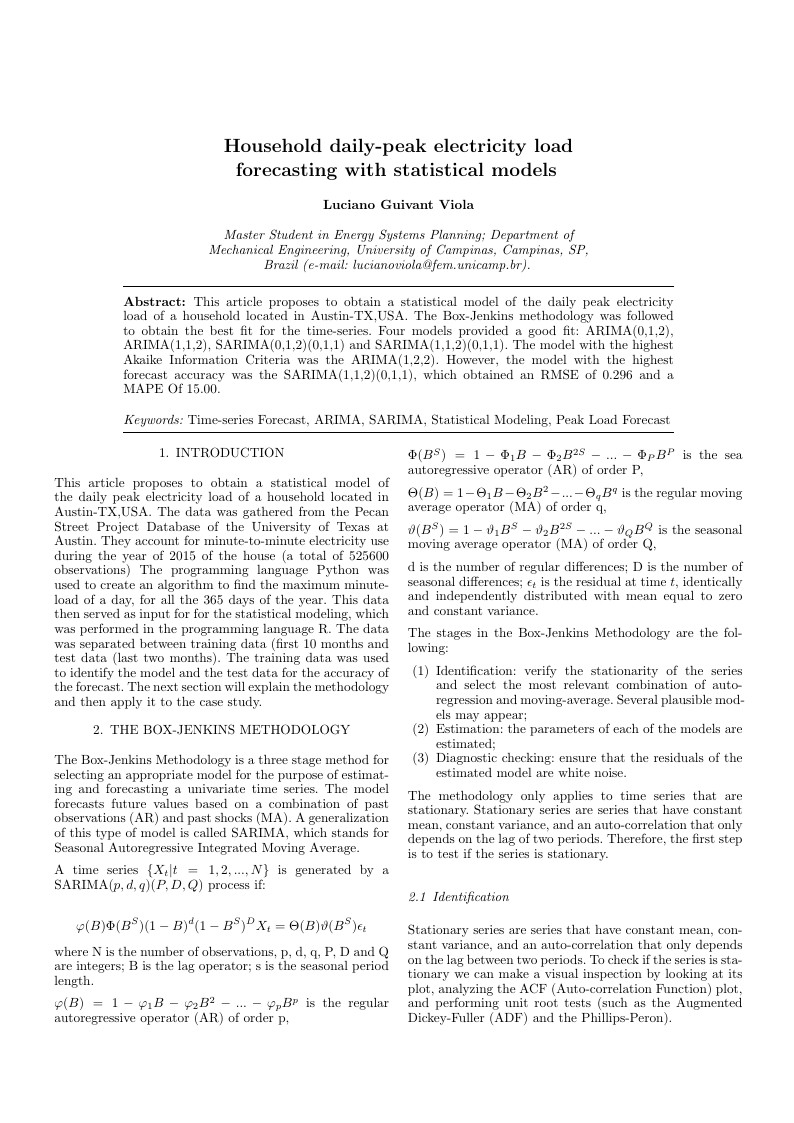
This article proposes to obtain a statistical model of the daily peak electricity load of a household located in Austin-TX,USA. The Box-Jenkins methodology was followed to obtain the best fit for the time-series. Four models provided a good fit: ARIMA(0,1,2), ARIMA(1,1,2), SARIMA(0,1,2)(0,1,1) and SARIMA(1,1,2)(0,1,1). The model with the highest Akaike Information Criteria was the ARIMA(1,2,2). However, the model with the highest forecast accuracy was the SARIMA(1,1,2)(0,1,1), which obtained an RMSE of 0.296 and a MAPE Of 15.00.
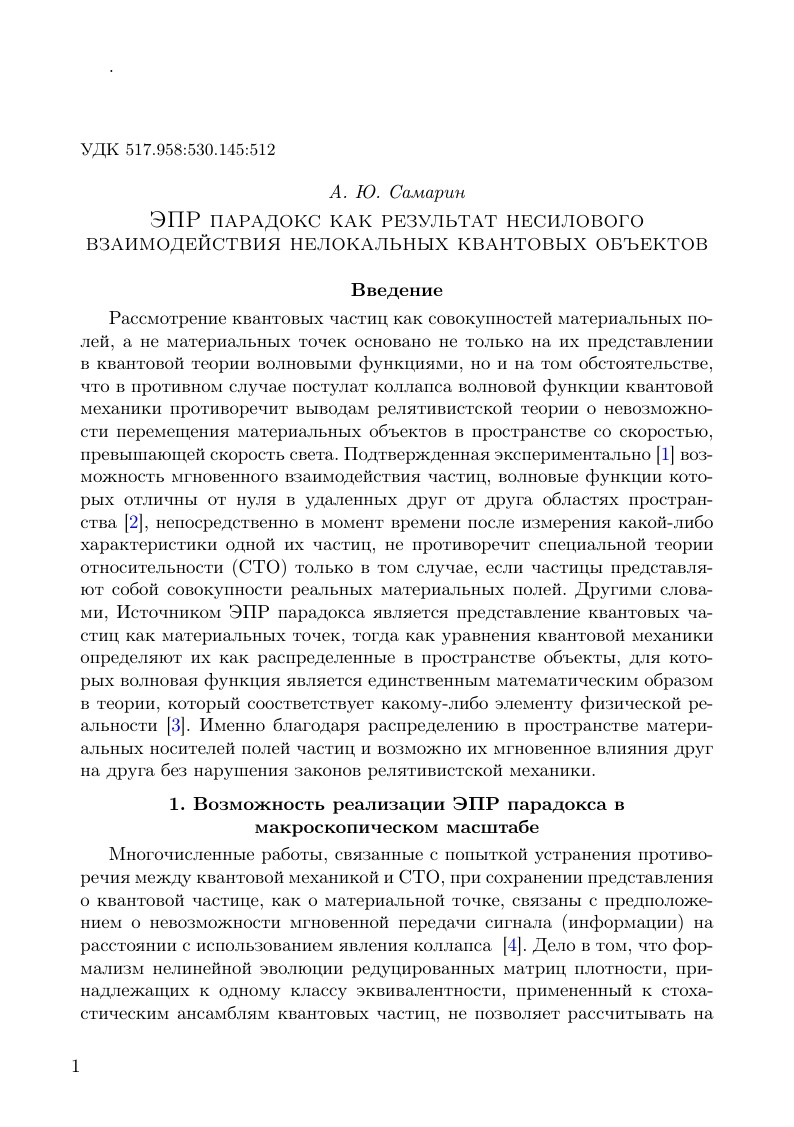
EPR paradox as a result of non-force interaction nonlocal quantum objects This is a LaTeX template (version from 2016 Feb. 17) for preparing documents for All-Russian Scientific Conference of the Mathematical Modeling and Boundary Value Problems [Matem. Mod. Kraev. Zadachi, Samara, Russian Federation]. It was submitted by an author writing for the 10th All-Russian Scientific Conference with international participation (MMiKZ’16).
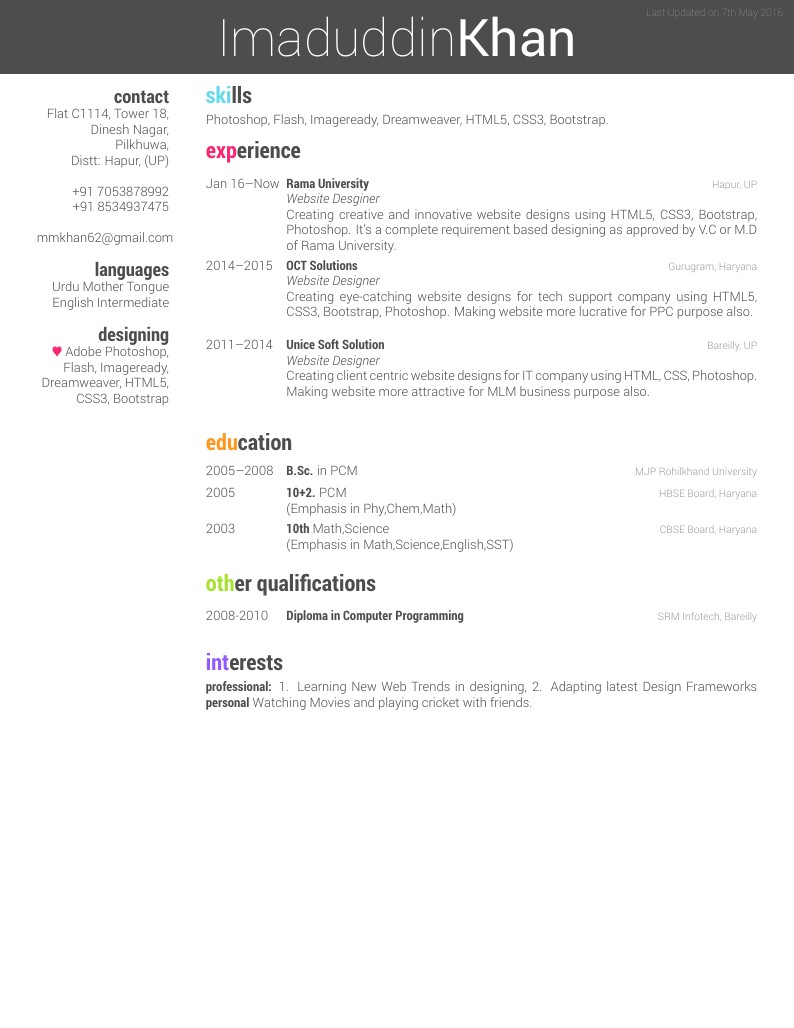
Imaduddin Khan's CV
\begin
Discover why over 25 million people worldwide trust Overleaf with their work.