LaTeX templates and examples — Two-column
Recent
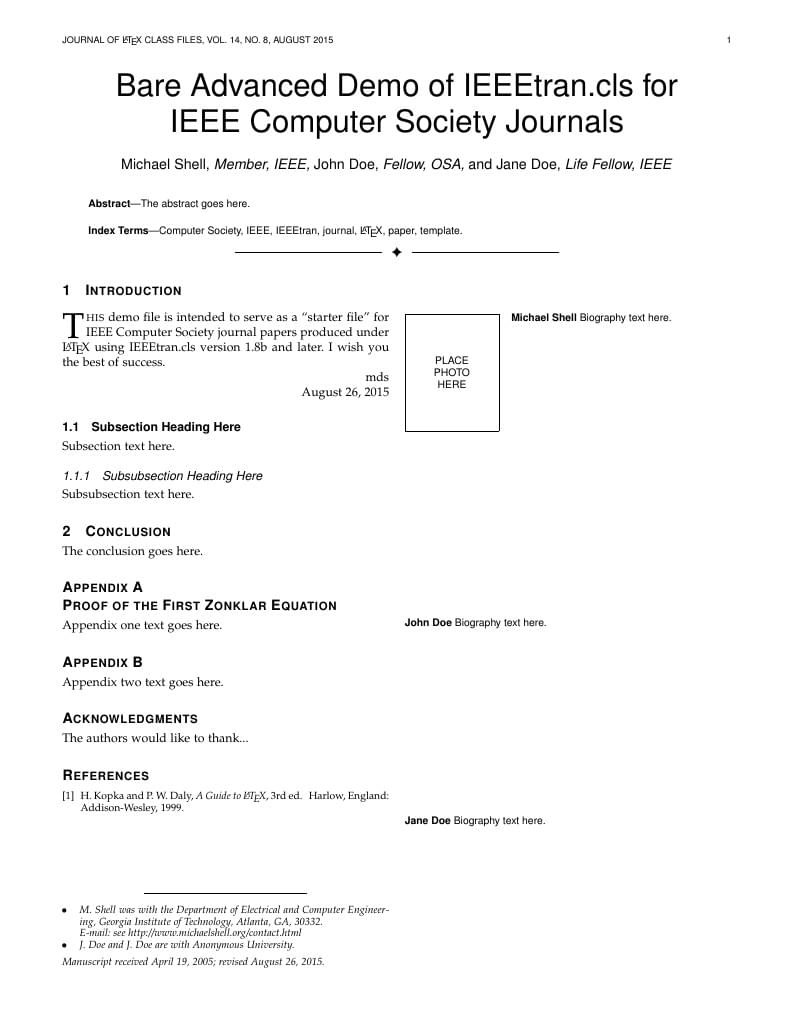
This is a skeleton file demonstrating the advanced use of IEEEtran.cls with an IEEE Computer Society journal paper. This is one of a number of IEEE LaTeX templates available on Overleaf to help you get started, and if it's not the one you're looking for, you can use the tags below to find more. IEEEtran.cls version: 1.8b
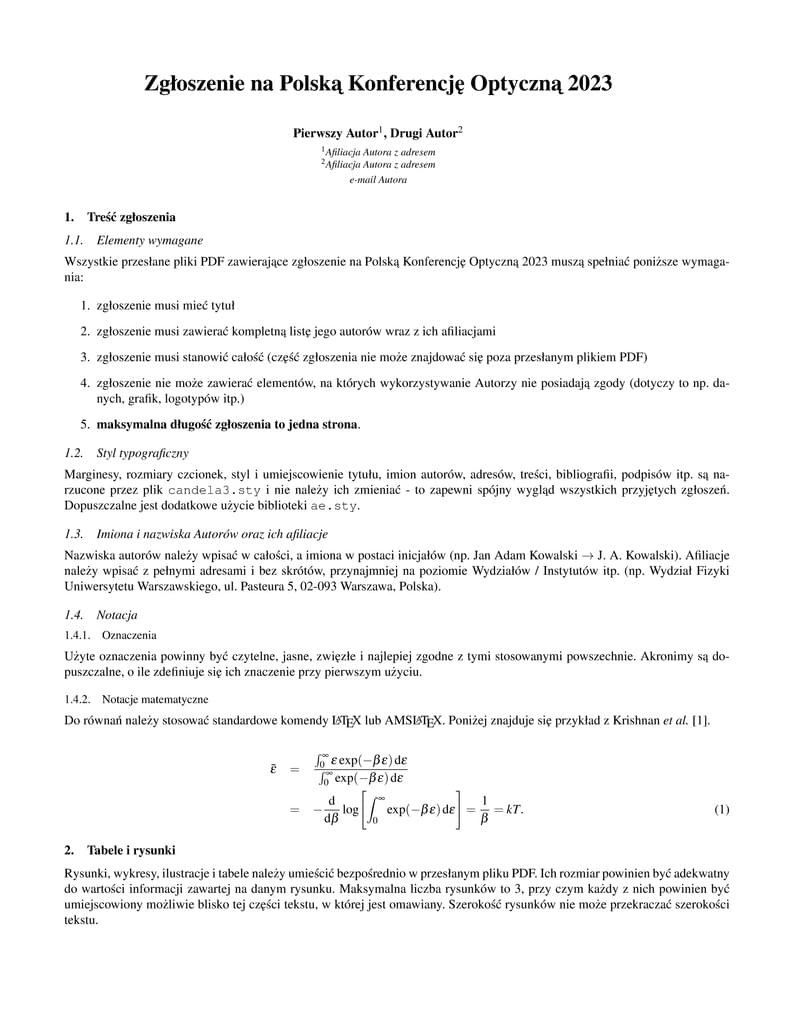
Szablon zgłoszenia na Polską Konferencję Optyczną, przygotowany przez Fundację Candela
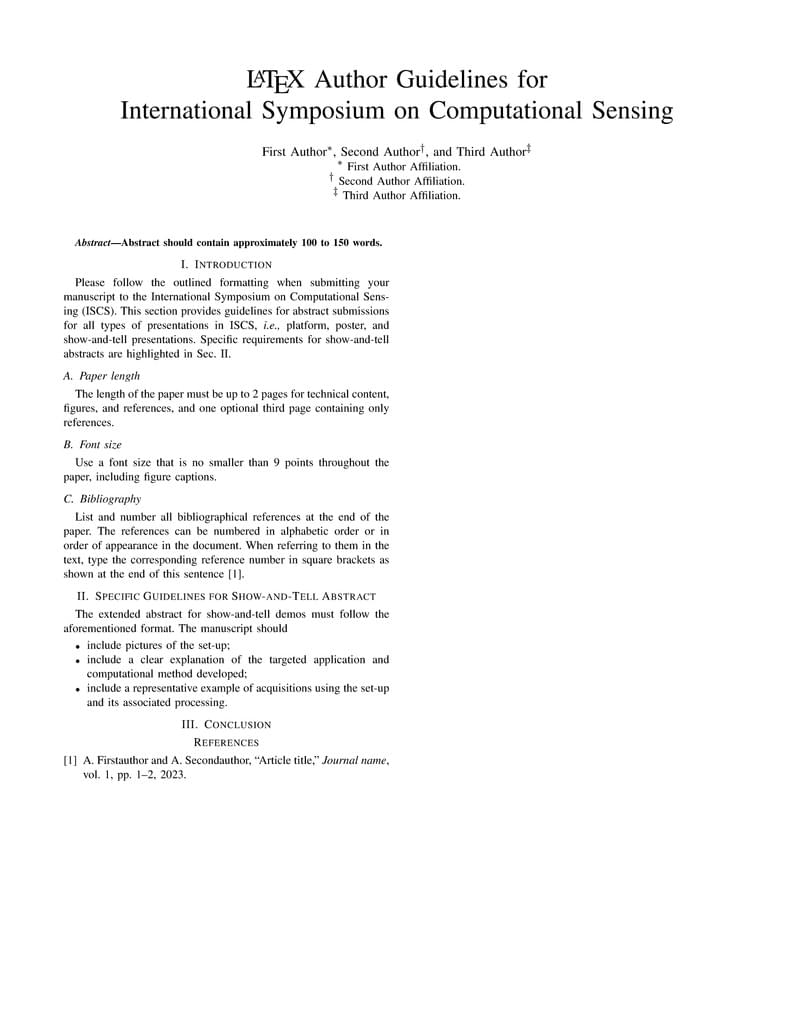
This is the official template of the International Symposium on Computational Sensing. Use this template for both extended abstracts and show-and-tell.
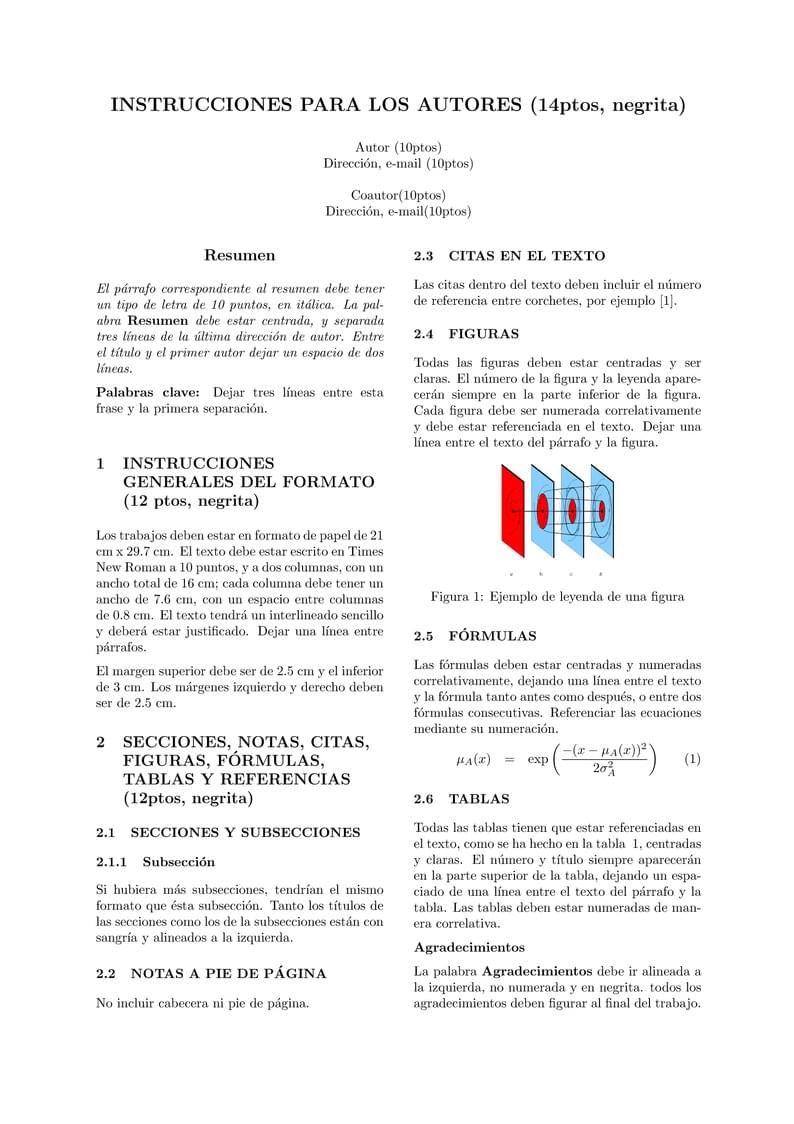
Template Jornadas Automática (Español)
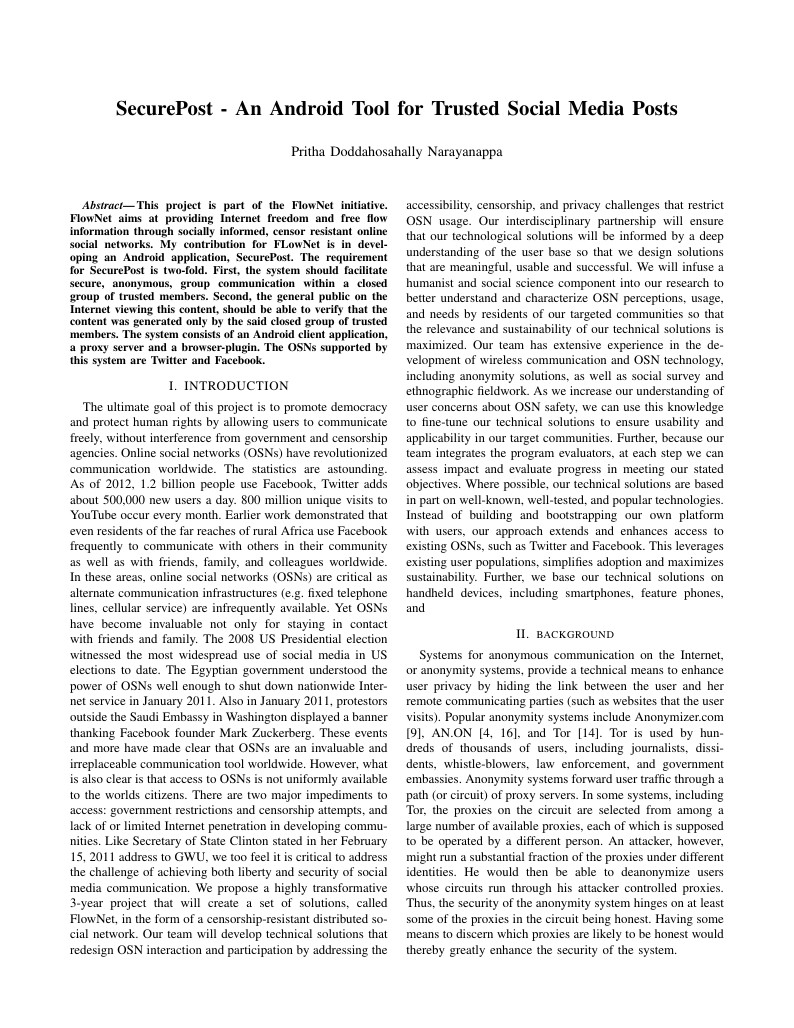
his project is part of the FlowNet initiative. FlowNet aims at providing Internet freedom and free flow information through socially informed, censor resistant online social networks. My contribution for FLowNet is in devel- oping an Android application, SecurePost. The requirement for SecurePost is two-fold. First, the system should facilitate secure, anonymous, group communication within a closed group of trusted members. Second, the general public on the Internet viewing this content, should be able to verify that the content was generated only by the said closed group of trusted members. The system consists of an Android client application, a proxy server and a browser-plugin. The OSNs supported by this system are Twitter and Facebook.
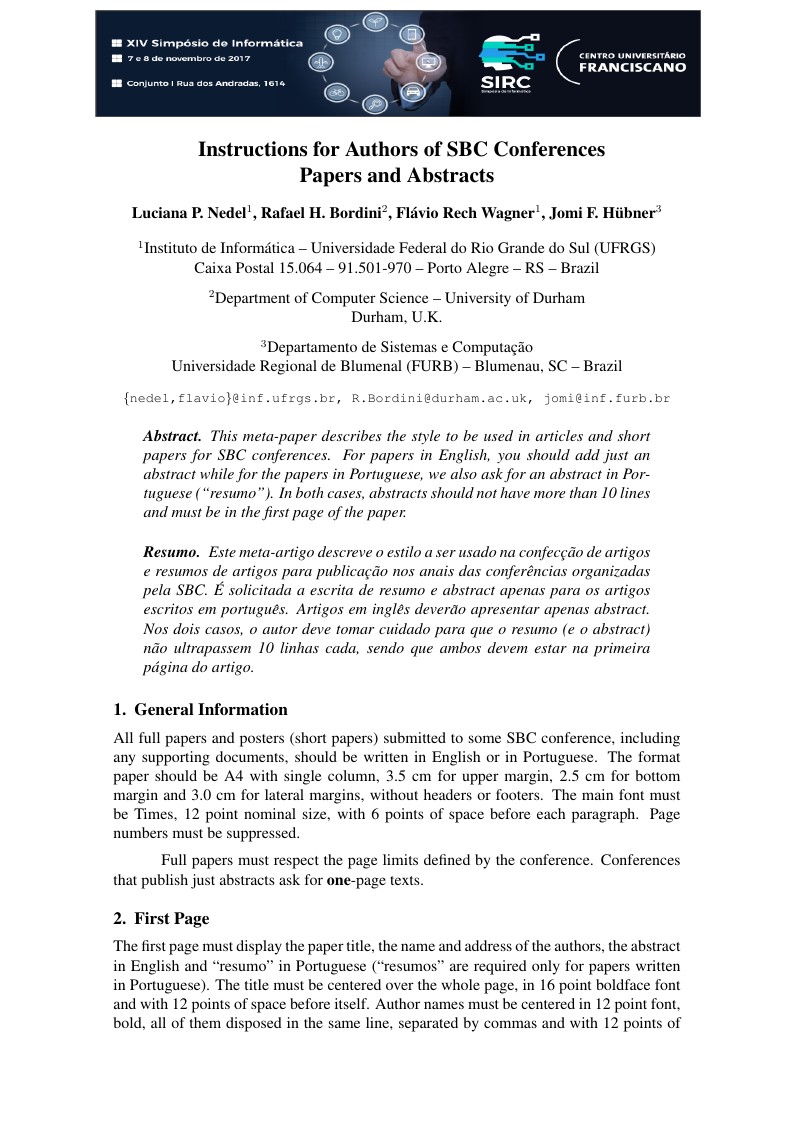
Modelo de publicação para o SIRC 2017 - Centro Universitário Franciscano, baseado no Template SBC
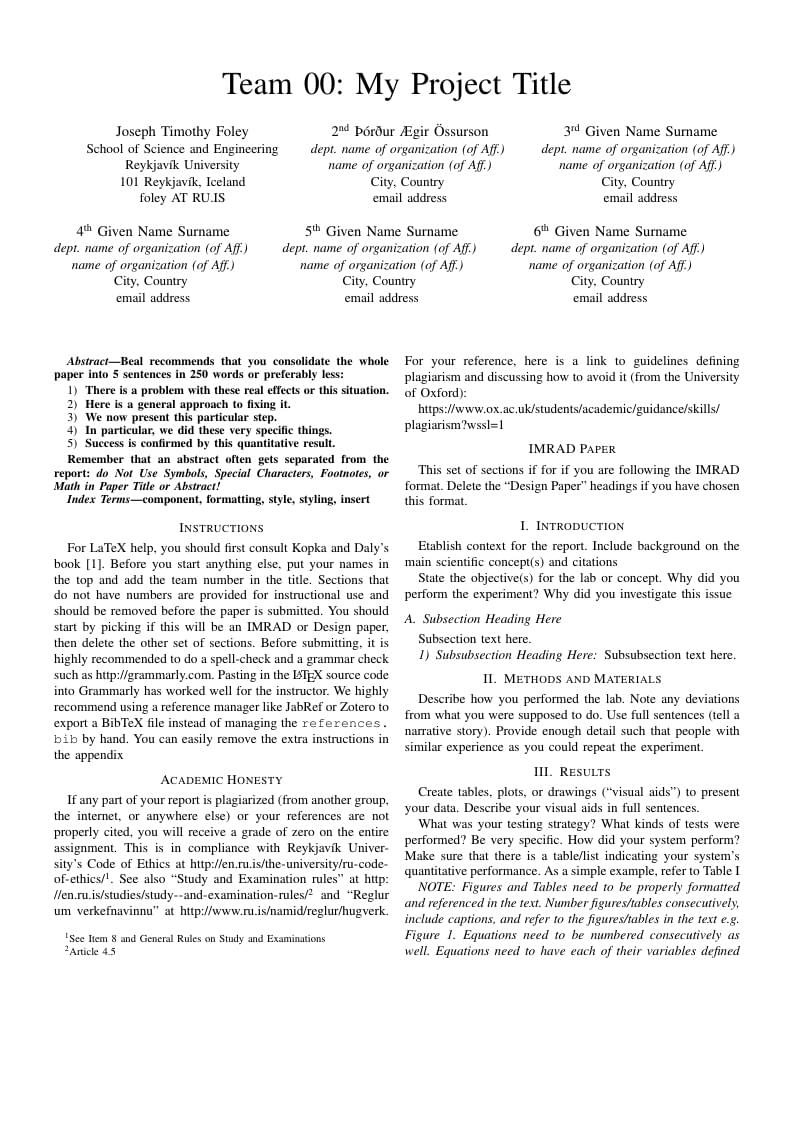
This is an enhanced IEEE conference template for the IEEE Conference on Sustainable Technologies. It is of primary interest for students in the "Intro to Engineering courses" (AT TÆK1002 and T-102-VERK) at Reykjavik University.
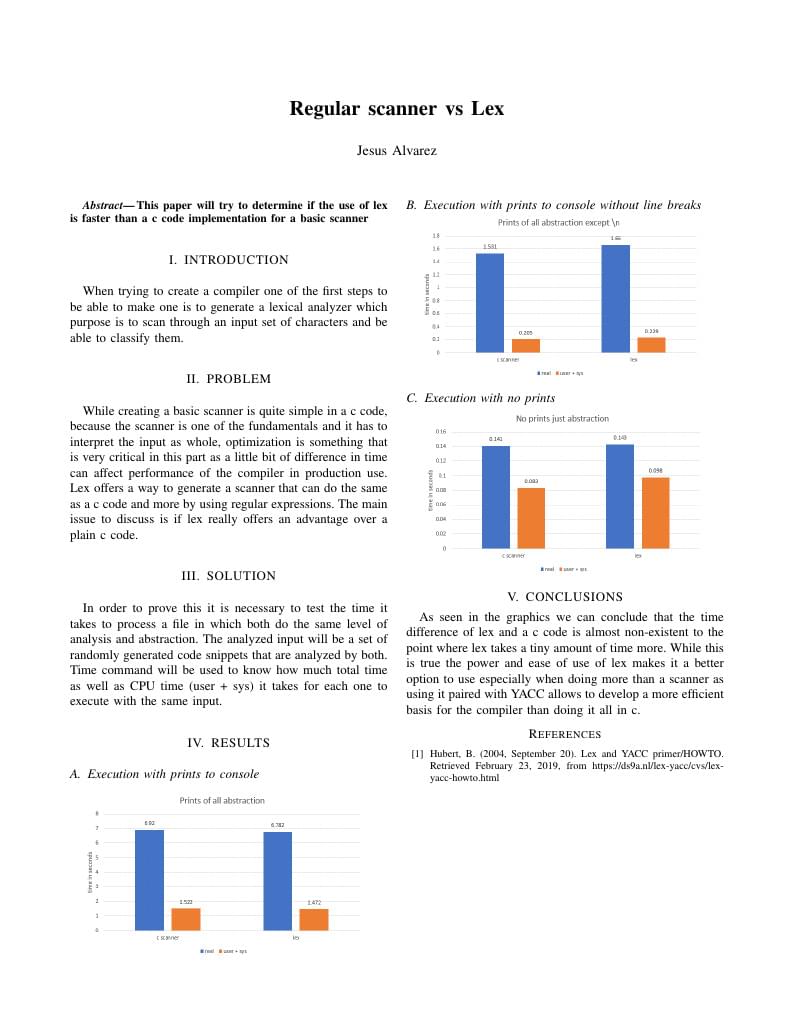
comparison of lex and a c scanner
Template para relatórios em formato de artigo em duas colunas
\begin
Discover why over 25 million people worldwide trust Overleaf with their work.