BoxRotation
Author:
Javi Pérez
Last Updated:
6年前
License:
Creative Commons CC BY 4.0
Abstract:
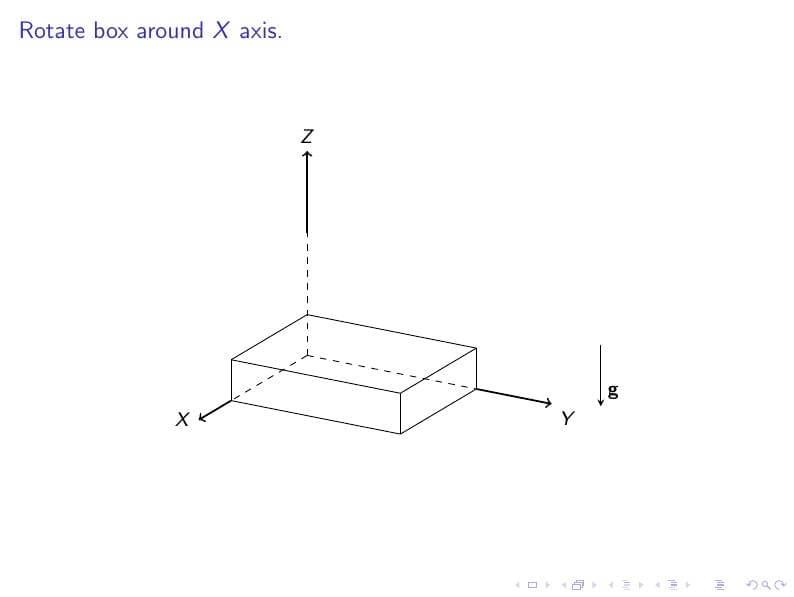
Rotate a box around some axes: X axis, Y axix, Z axis, any axis
\begin
Discover why over 25 million people worldwide trust Overleaf with their work.
\begin
Discover why over 25 million people worldwide trust Overleaf with their work.
\documentclass[compress,9pt]{beamer}

\usepackage{pgfpages}


\usepackage{tikz}   %TikZ is required for this to work.  Make sure this exists before the next line
\usepackage{tikz-3dplot} %requires 3dplot.sty to be in same directory, or in your LaTeX installation

\begin{document}

	\section{Rotate a box around some axes.}
	\begin{frame}{Rotate box around $X$ axis.}
		\begin{figure}[h]
			\centering
			\def\r{3.5}
			\pgfmathsetmacro{\alphaNextBox}{90}
			\pgfmathsetmacro{\betaNextBox}{-55}
			\pgfmathsetmacro{\gammaNextBox}{-90}
			%%% \pgfmathsetmacro{\inclination}{70}
			\pgfmathsetmacro{\alphaEuler}{0}
			\pgfmathsetmacro{\betaEuler}{0}
			\pgfmathsetmacro{\gammaEuler}{47}

			\tdplotsetmaincoords{70}{120}
			\begin{tikzpicture}[tdplot_main_coords]
			% Drawing XYZ coordinates system
			\def \lenX {1.0*\r}
			\def \lenY {1.3*\r}
			\def \lenZ {1.0*\r}
			\def \boxX{.7*\r}
			\def \boxY{.9*\r}
			\def \boxZ{.2*\r}
			% Calculate box corner length
			\pgfmathsetmacro{\boxCornerLen}{sqrt{((\boxX)^2 + (\boxY)^2 + (\boxZ)^2)}}
			% Draw coordinate system
			\draw[dashed] (0,0,0) -- (\boxX,0,0);
			\draw[->,thick] (\boxX,0,0) -- (\lenX,0,0) node[left] {$X$};
			\draw[dashed] (0,0,0) -- (0,\boxY,0);
			\draw[->,thick] (0,\boxY,0) -- (0,\lenY,0) node[anchor=north west] {$Y$};
			\draw[dashed] (0,0,0) -- (0,0,0.6*\lenZ);
			\draw[->,thick] (0,0,0.6*\lenZ) -- (0,0,\lenZ) node[anchor=south] {$Z$};
			% Draw gravity vector
			\draw[-stealth,thin] (-0.8*\r,1.1*\r,0) -- (-0.8*\r,1.1*\r,-.3*\r) node[anchor=south west] {$\mathbf{g}$};

			% Drawing horizontal box:
			% Get corner polar coordinate
			\tdplotgetpolarcoords{\boxX}{\boxY}{\boxZ}
			\tdplotsetcoord{Box}{\boxCornerLen}{\tdplotrestheta}{\tdplotresphi}
			% Draw a box
			% \draw[] (O) -- (Boxx);
			% \draw[] (O) -- (Boxy);
			% \draw[] (O) -- (Boxz);
			\draw[] (Boxx) -- (Boxxy);
			\draw[] (Boxy) -- (Boxxy);
			\draw[] (Boxx) -- (Boxxz);
			\draw[] (Boxz) -- (Boxxz);
			\draw[] (Boxy) -- (Boxyz);
			\draw[] (Boxz) -- (Boxyz);
			\draw[] (Boxxy) -- (Box);
			\draw[] (Boxxz) -- (Box);
			\draw[] (Boxyz) -- (Box);
			\pause
			% Create a new rotated system in the center
			\tdplotsetrotatedcoords{\alphaEuler}{\betaEuler}{\gammaEuler}
			% Draw new coordinates system
			% Hidden line
			\draw[dashed,tdplot_rotated_coords,red] (0,0,0) -- (1.4*\boxX,0,0);
			% Visible line
			\draw[thick,tdplot_rotated_coords,->,red] (1.4*\boxX,0,0) -- (1.3*\lenX,0,0) node[anchor=north east]{$E$};
			% Hidden line
			\draw[dashed,tdplot_rotated_coords,red] (0,0,0) -- (0,0.7*\boxY,0);
			% Visible line
			\draw[thick,tdplot_rotated_coords,->,red] (0,0.7*\boxY,0) -- (0,0.8*\lenY,0) node[anchor=south west]{$\mathbf{N}$};
			% Hidden line
			\draw[dashed,tdplot_rotated_coords,red] (0,0,0) -- (0,0,0.6*\lenZ);
			% Visible line
			\draw[thick,tdplot_rotated_coords,->,red] (0,0,0.6*\lenZ) -- (0,0,0.8*\lenZ) node[anchor=north east]{$Z$};
			\pause
			% Rotating box around X axis:
			% Create a new rotated system in the center.
			\tdplotsetrotatedcoords{\alphaNextBox}{\betaNextBox}{\gammaNextBox}
			% Draw a box in the  new coordinates system
			\draw[tdplot_rotated_coords,gray] (\boxX,0,0) -- (\boxX,\boxY,0);
			\draw[tdplot_rotated_coords,gray] (\boxX,\boxY,0) -- (0,\boxY,0);
			\draw[tdplot_rotated_coords,gray] (0,\boxY,0) -- (0,\boxY,\boxZ);
			\draw[tdplot_rotated_coords,dashed,gray] (0,\boxY,\boxZ) -- (0,0,\boxZ);
			\draw[tdplot_rotated_coords,dashed,gray] (0,0,\boxZ) -- (\boxX,0,\boxZ);
			\draw[tdplot_rotated_coords,gray] (\boxX,0,\boxZ) -- (\boxX,0,0);
			\draw[tdplot_rotated_coords,gray] (\boxX,0,0) -- (\boxX,0,\boxZ);
			\draw[tdplot_rotated_coords,gray] (\boxX,0,\boxZ) -- (\boxX,\boxY,\boxZ);
			\draw[tdplot_rotated_coords,gray] (\boxX,\boxY,\boxZ) -- (0,\boxY,\boxZ);
			\draw[tdplot_rotated_coords,gray] (\boxX,\boxY,\boxZ) -- (\boxX,\boxY,0);
			\draw[tdplot_rotated_coords,dashed,gray] (0,0,\boxZ) -- (0,0,0);
			\draw[tdplot_rotated_coords,gray] (0,0,0) -- (0,\boxY,0);

			\tdplotsetrotatedcoordsorigin{(Shift)}
			% Shift the rotated coordinates
			\coordinate (Shift) at (\boxX,0,0);
			% Draw rotation
			\tdplotsetthetaplanecoords{90}
			% \tdplotdrawarc[coordinate system, draw styles]{center}{r}{angle start}{angle end}{label options}{label}
			\tdplotdrawarc[tdplot_rotated_coords,gray,thick,dotted,<->]{(Shift)}{\boxY}{90}{90+\betaNextBox}{anchor=west}{}

			% Resets the origin of the rotated coordinate system back to the origin of the main coordinate system.
			%\tdplotresetrotatedcoordsorigin
			\coordinate (Shift) at (0,0,0);
			\end{tikzpicture}
		\end{figure}
	\end{frame}

	\begin{frame}[fragile]{Rotate box around $Y$ axis.}
		\begin{figure}[h]
			\centering
			\def\r{3.5}
			\pgfmathsetmacro{\alphaNextBox}{0}%{90}
			\pgfmathsetmacro{\betaNextBox}{-50}%{-55}
			\pgfmathsetmacro{\gammaNextBox}{0}%{-90}
			%%% \pgfmathsetmacro{\inclination}{70}
			\pgfmathsetmacro{\alphaEuler}{0}
			\pgfmathsetmacro{\betaEuler}{0}
			\pgfmathsetmacro{\gammaEuler}{47}

			\tdplotsetmaincoords{70}{120}
			\begin{tikzpicture}[tdplot_main_coords]
			% Drawing XYZ coordinates system
			\def \lenX {1.0*\r}
			\def \lenY {1.3*\r}
			\def \lenZ {1.0*\r}
			\def \boxX{.7*\r}
			\def \boxY{.9*\r}
			\def \boxZ{.2*\r}
			% Calculate box corner length
			\pgfmathsetmacro{\boxCornerLen}{sqrt{((\boxX)^2 + (\boxY)^2 + (\boxZ)^2)}}
			% Draw coordinate system
			\draw[dashed] (0,0,0) -- (\boxX,0,0);
			\draw[->,thick] (\boxX,0,0) -- (\lenX,0,0) node[left] {$X$};
			\draw[dashed] (0,0,0) -- (0,\boxY,0);
			\draw[->,thick] (0,\boxY,0) -- (0,\lenY,0) node[anchor=north west] {$Y$};
			\draw[dashed] (0,0,0) -- (0,0,0.6*\lenZ);
			\draw[->,thick] (0,0,0.6*\lenZ) -- (0,0,\lenZ) node[anchor=south] {$Z$};
			% Draw gravity vector
			\draw[-stealth,thin] (-0.8*\r,1.1*\r,0) -- (-0.8*\r,1.1*\r,-.3*\r) node[anchor=south west] {$\mathbf{g}$};

			% Drawing horizontal box:
			% Get corner polar coordinate
			\tdplotgetpolarcoords{\boxX}{\boxY}{\boxZ}
			\tdplotsetcoord{Box}{\boxCornerLen}{\tdplotrestheta}{\tdplotresphi}
			% Draw a box
			% \draw[] (O) -- (Boxx);
			% \draw[] (O) -- (Boxy);
			% \draw[] (O) -- (Boxz);
			\draw[] (Boxx) -- (Boxxy);
			\draw[] (Boxy) -- (Boxxy);
			\draw[] (Boxx) -- (Boxxz);
			\draw[] (Boxz) -- (Boxxz);
			\draw[] (Boxy) -- (Boxyz);
			\draw[] (Boxz) -- (Boxyz);
			\draw[] (Boxxy) -- (Box);
			\draw[] (Boxxz) -- (Box);
			\draw[] (Boxyz) -- (Box);
			\pause
			% Create a new rotated system in the center
			\tdplotsetrotatedcoords{\alphaEuler}{\betaEuler}{\gammaEuler}
			% Draw new coordinates system
			% Hidden line
			\draw[dashed,tdplot_rotated_coords,red] (0,0,0) -- (1.4*\boxX,0,0);
			% Visible line
			\draw[thick,tdplot_rotated_coords,->,red] (1.4*\boxX,0,0) -- (1.3*\lenX,0,0) node[anchor=north east]{$E$};
			% Hidden line
			\draw[dashed,tdplot_rotated_coords,red] (0,0,0) -- (0,0.7*\boxY,0);
			% Visible line
			\draw[thick,tdplot_rotated_coords,->,red] (0,0.7*\boxY,0) -- (0,0.8*\lenY,0) node[anchor=south west]{$\mathbf{N}$};
			% Hidden line
			\draw[dashed,tdplot_rotated_coords,red] (0,0,0) -- (0,0,0.6*\lenZ);
			% Visible line
			\draw[thick,tdplot_rotated_coords,->,red] (0,0,0.6*\lenZ) -- (0,0,0.8*\lenZ) node[anchor=north east]{$Z$};
			\pause
			% Rotating box around one new axis:
			% Create a new rotated system in the center.
			\tdplotsetrotatedcoords{\alphaNextBox}{\betaNextBox}{\gammaNextBox}
			% Draw a box in the  new coordinates system
			\draw[tdplot_rotated_coords,gray] (\boxX,0,0) -- (\boxX,\boxY,0);
			\draw[tdplot_rotated_coords,gray] (\boxX,\boxY,0) -- (0,\boxY,0);
			\draw[tdplot_rotated_coords,gray] (0,\boxY,0) -- (0,\boxY,\boxZ);
			\draw[tdplot_rotated_coords,dashed,gray] (0,\boxY,\boxZ) -- (0,0,\boxZ);
			\draw[tdplot_rotated_coords,dashed,gray] (0,0,\boxZ) -- (\boxX,0,\boxZ);
			\draw[tdplot_rotated_coords,gray] (\boxX,0,\boxZ) -- (\boxX,0,0);
			\draw[tdplot_rotated_coords,gray] (\boxX,0,0) -- (\boxX,0,\boxZ);
			\draw[tdplot_rotated_coords,gray] (\boxX,0,\boxZ) -- (\boxX,\boxY,\boxZ);
			\draw[tdplot_rotated_coords,gray] (\boxX,\boxY,\boxZ) -- (0,\boxY,\boxZ);
			\draw[tdplot_rotated_coords,gray] (\boxX,\boxY,\boxZ) -- (\boxX,\boxY,0);
			\draw[tdplot_rotated_coords,dashed,gray] (0,0,\boxZ) -- (0,0,0);
			\draw[tdplot_rotated_coords,gray] (0,0,0) -- (0,\boxY,0);
			\draw[tdplot_rotated_coords,gray] (0,0,0) -- (\boxX,0,0);

			\tdplotsetthetaplanecoords{0}
			\tdplotdrawarc[tdplot_rotated_coords,gray,thick,dotted,<->]{(0,0,0)}{\boxX}{90}{90+\betaNextBox}{anchor=west}{}
			\end{tikzpicture}
			%\caption{Giros en torno al eje $X$ para comprobar el comportamiento distorsionado de la brújula.}\label{fig:rollRotation}
		\end{figure}
	\end{frame}

	\begin{frame}[fragile]{Rotate a box around $Z$ axis}
		\begin{figure}[H]
			\centering
			\def\r{3.5}
			\pgfmathsetmacro{\alphaEuler}{0}
			\pgfmathsetmacro{\betaEuler}{0}
			\pgfmathsetmacro{\gammaEuler}{47}

			\pgfmathsetmacro{\nuSatellite}{55}
			\pgfmathsetmacro{\gammaAngle}{290}

			%\tdplotsetmaincoords{70}{155}
			\tdplotsetmaincoords{70}{120}
			\begin{tikzpicture}[tdplot_main_coords]
			% Draw ENZ coordinates system
			\def \lenX {1.0*\r}
			\def \lenY {1.3*\r}
			\def \lenZ {0.5*\r}
			\def \boxX{.7*\r}
			\def \boxY{.9*\r}
			\def \boxZ{.2*\r}

			% Calculate box corner length
			\pgfmathsetmacro{\boxCornerLen}{sqrt{((\boxX)^2 + (\boxY)^2 + (\boxZ)^2)}}
			% Draw coordinate system
			\draw[dashed] (0,0,0) -- (\boxX,0,0);
			\draw[->,thick] (\boxX,0,0) -- (\lenX,0,0) node[left] {$E$};
			\draw[dashed] (0,0,0) -- (0,\boxY,0);
			\draw[->,thick] (0,\boxY,0) -- (0,\lenY,0) node[anchor=north west] {$\mathbf{N}$};
			\draw[dashed] (0,0,0) -- (0,0,0.6*\lenZ);
			\draw[->,thick] (0,0,0.6*\lenZ) -- (0,0,\lenZ) node[anchor=south] {$Z$};
			% Draw gravity vector
			\draw[-stealth,thin] (-0.8*\r,1.1*\r,0) -- (-0.8*\r,1.1*\r,-.3*\r) node[anchor=south west] {$\mathbf{g}$};

			% Drawing horizontal box:
			% Get corner polar coordinate
			\tdplotgetpolarcoords{\boxX}{\boxY}{\boxZ}
			\tdplotsetcoord{Box}{\boxCornerLen}{\tdplotrestheta}{\tdplotresphi}
			% Draw a box
			% \draw[] (O) -- (Boxx);
			% \draw[] (O) -- (Boxy);
			% \draw[] (O) -- (Boxz);
			\draw[] (Boxx) -- (Boxxy);
			\draw[] (Boxy) -- (Boxxy);
			\draw[] (Boxx) -- (Boxxz);
			\draw[] (Boxz) -- (Boxxz);
			\draw[] (Boxy) -- (Boxyz);
			\draw[] (Boxz) -- (Boxyz);
			\draw[] (Boxxy) -- (Box);
			\draw[] (Boxxz) -- (Box);
			\draw[] (Boxyz) -- (Box);

			\pause
			% Create a new rotated system in the center
			\tdplotsetrotatedcoords{\alphaEuler}{\betaEuler}{\gammaEuler}
			% Draw a box in the  new coordinates system
			\draw[tdplot_rotated_coords,gray] (\boxX,0,0) -- (\boxX,\boxY,0) -- (0,\boxY,0) -- (0,\boxY,\boxZ) -- (0,0,\boxZ) -- (\boxX,0,\boxZ) -- (\boxX,0,0);
			\draw[tdplot_rotated_coords,gray] (\boxX,0,\boxZ) -- (\boxX,\boxY,\boxZ) -- (0,\boxY,\boxZ);
			\draw[tdplot_rotated_coords,gray] (\boxX,\boxY,\boxZ) -- (\boxX,\boxY,0);
			% Draw new coordinates system
			% Hidden line
			\draw[dashed,tdplot_rotated_coords,gray] (0,0,0) -- (\boxX,0,0);
			% Visible line
			\draw[thick,tdplot_rotated_coords,->,gray] (\boxX,0,0) -- (1.3*\lenX,0,0) node[anchor=north east]{$X$};
			% Hidden line
			\draw[dashed,tdplot_rotated_coords,gray] (0,0,0) -- (0,\boxY,0);
			% Visible line
			\draw[thick,tdplot_rotated_coords,->,gray] (0,\boxY,0) -- (0,1.3*\lenY,0) node[anchor=south west]{$Y$};
			% Hidden line
			\draw[dashed,tdplot_rotated_coords,gray] (0,0,0) -- (0,0,\boxZ);
			% Visible line
			\draw[thick,tdplot_rotated_coords,->,gray] (0,0,\boxZ) -- (0,0,0.8*\lenZ) node[anchor=north west]{$Z$};
			% Draw rotation
			% \tdplotdrawarc[coordinate system, draw styles]{center}{r}{angle start}{angle end}{label options}{label}
			\tdplotdrawarc[thick,dotted,<->]{(0,0,0.5*\lenZ)}{0.5*\r}{-270}{0}{anchor=west}{}
			\end{tikzpicture}
		\end{figure}
	\end{frame}

	\begin{frame}[fragile]{Rotate a box aroud any axis}
		\begin{figure}[h]
			\centering
			\def\r{3.5}
			\pgfmathsetmacro{\alphaNorth}{40}
			\pgfmathsetmacro{\betaNorth}{0}
			\pgfmathsetmacro{\gammaNorth}{0}

			\pgfmathsetmacro{\alphaNewAxis}{-35}
			\pgfmathsetmacro{\betaNewAxis}{0}
			\pgfmathsetmacro{\gammaNewAxis}{0}

			\pgfmathsetmacro{\alphaNextBox}{\alphaNewAxis}
			\pgfmathsetmacro{\betaNextBox}{-40}
			\pgfmathsetmacro{\gammaNextBox}{0}
			%%% \pgfmathsetmacro{\inclination}{70}

			\tdplotsetmaincoords{70}{160}
			\begin{tikzpicture}[tdplot_main_coords]
			% Drawing XYZ coordinates system
			\def \lenX {1.0*\r}
			\def \lenY {1.3*\r}
			\def \lenZ {1.0*\r}
			\def \boxX{.7*\r}
			\def \boxY{.9*\r}
			\def \boxZ{.2*\r}
			% Calculate box corner length
			\pgfmathsetmacro{\boxCornerLen}{sqrt{((\boxX)^2 + (\boxY)^2 + (\boxZ)^2)}}
			% Draw coordinate system
			\draw[dashed] (0,0,0) -- (\boxX,0,0);
			\draw[->,thick] (\boxX,0,0) -- (\lenX,0,0) node[left] {$X$};
			\draw[dashed] (0,0,0) -- (0,\boxY,0);
			\draw[->,thick] (0,\boxY,0) -- (0,\lenY,0) node[anchor=north west] {$Y$};
			\draw[dashed] (0,0,0) -- (0,0,0.6*\lenZ);
			\draw[->,thick] (0,0,0.6*\lenZ) -- (0,0,\lenZ) node[anchor=south] {$Z$};
			% Draw gravity vector
			\draw[-stealth,thin] (-0.8*\r,1.1*\r,0) -- (-0.8*\r,1.1*\r,-.3*\r) node[anchor=south west] {$\mathbf{g}$};

			% Drawing horizontal box:
			% Get corner polar coordinate
			\tdplotgetpolarcoords{\boxX}{\boxY}{\boxZ}
			\tdplotsetcoord{Box}{\boxCornerLen}{\tdplotrestheta}{\tdplotresphi}
			% Draw a box
			% \draw[] (O) -- (Boxx);
			% \draw[] (O) -- (Boxy);
			% \draw[] (O) -- (Boxz);
			\draw[] (Boxx) -- (Boxxy);
			\draw[] (Boxy) -- (Boxxy);
			\draw[] (Boxx) -- (Boxxz);
			\draw[] (Boxz) -- (Boxxz);
			\draw[] (Boxy) -- (Boxyz);
			\draw[] (Boxz) -- (Boxyz);
			\draw[] (Boxxy) -- (Box);
			\draw[] (Boxxz) -- (Box);
			\draw[] (Boxyz) -- (Box);
			\pause
			% Create a new rotated system in the center for North direction
			\tdplotsetrotatedcoords{\alphaNorth}{\betaNorth}{\gammaNorth}
			% Draw new coordinates system
			% Hidden line
			\draw[dashed,tdplot_rotated_coords,red] (0,0,0) -- (1.4*\boxX,0,0);
			% Visible line
			\draw[thick,tdplot_rotated_coords,->,red] (1.4*\boxX,0,0) -- (1.3*\lenX,0,0) node[anchor=north east]{$E$};
			% Hidden line
			\draw[dashed,tdplot_rotated_coords,red] (0,0,0) -- (0,0.3*\boxY,0);
			% Visible line
			\draw[thick,tdplot_rotated_coords,->,red] (0,0.3*\boxY,0) -- (0,0.8*\lenY,0) node[anchor=south west]{$\mathbf{N}$};
			% Hidden line
			\draw[dashed,tdplot_rotated_coords,red] (0,0,0) -- (0,0,1.1*\boxZ);
			% Visible line
			\draw[thick,tdplot_rotated_coords,->,red] (0,0,1.1*\boxZ) -- (0,0,0.8*\lenZ) node[anchor=north east]{$Z$};


			\pause
			% Create a new rotated system in the center
			\tdplotsetrotatedcoords{\alphaNewAxis}{\betaNewAxis}{\gammaNewAxis}
			% Draw new coordinates system
			%\draw[dashed,tdplot_rotated_coords,orange] (0,0,0) --  (1.3*\lenX,0,0) node[anchor=north east]{$x$};
			\draw[dashed,tdplot_rotated_coords,blue] (0,0,0) -- (0,1.6*\lenY,0) node[anchor=north east]{Rotation axis};
			%\draw[dashed,tdplot_rotated_coords,orange] (0,0,0) -- (0,0,1.3*\lenZ) node[anchor=north east]{$z$};
			%
			% Calculate Box coordinates in rotated system {\boxX}{\boxY}{\boxZ}
			\tdplottransformmainrot{\boxX}{0}{0}
			\pgfmathsetmacro{\BoxNewXoox}{\tdplotresx}
			\pgfmathsetmacro{\BoxNewXooy}{\tdplotresy}
			\pgfmathsetmacro{\BoxNewXooz}{\tdplotresz}
			%\coordinate (BoxNewX00) at (\tdplotresx,\tdplotresy,\tdplotresz);
			\tdplottransformmainrot{0}{\boxY}{0}
			\pgfmathsetmacro{\BoxNewoYox}{\tdplotresx}
			\pgfmathsetmacro{\BoxNewoYoy}{\tdplotresy}
			\pgfmathsetmacro{\BoxNewoYoz}{\tdplotresz}
			%\coordinate (BoxNew0Y0) at (\tdplotresx,\tdplotresy,\tdplotresz);
			\tdplottransformmainrot{0}{0}{\boxZ}
			\pgfmathsetmacro{\BoxNewooZx}{\tdplotresx}
			\pgfmathsetmacro{\BoxNewooZy}{\tdplotresy}
			\pgfmathsetmacro{\BoxNewooZz}{\tdplotresz}
			%\coordinate (BoxNew00Z) at (\tdplotresx,\tdplotresy,\tdplotresz);

			\tdplottransformmainrot{\boxX}{\boxY}{0}
			\pgfmathsetmacro{\BoxNewXYox}{\tdplotresx}
			\pgfmathsetmacro{\BoxNewXYoy}{\tdplotresy}
			\pgfmathsetmacro{\BoxNewXYoz}{\tdplotresz}
			%\coordinate (BoxNewXY0) at (\tdplotresx,\tdplotresy,\tdplotresz);

			\tdplottransformmainrot{\boxX}{0}{\boxZ}
			\pgfmathsetmacro{\BoxNewXoZx}{\tdplotresx}
			\pgfmathsetmacro{\BoxNewXoZy}{\tdplotresy}
			\pgfmathsetmacro{\BoxNewXoZz}{\tdplotresz}
			%\coordinate (BoxNewX0Z) at (\tdplotresx,\tdplotresy,\tdplotresz);
			\tdplottransformmainrot{0}{\boxY}{\boxZ}
			\pgfmathsetmacro{\BoxNewoYZx}{\tdplotresx}
			\pgfmathsetmacro{\BoxNewoYZy}{\tdplotresy}
			\pgfmathsetmacro{\BoxNewoYZz}{\tdplotresz}
			%\coordinate (BoxNew0YZ) at (\tdplotresx,\tdplotresy,\tdplotresz);
			\tdplottransformmainrot{\boxX}{\boxY}{\boxZ}
			\pgfmathsetmacro{\BoxNewXYZx}{\tdplotresx}
			\pgfmathsetmacro{\BoxNewXYZy}{\tdplotresy}
			\pgfmathsetmacro{\BoxNewXYZz}{\tdplotresz}
			%\coordinate (BoxNewXYZ) at (\tdplotresx,\tdplotresy,\tdplotresz);

			\coordinate (0) at (0,0,0);

			%\draw[tdplot_rotated_coords, orange] (0) -- (\BoxNewXoox,\BoxNewXooy,\BoxNewXooz) -- (\BoxNewXYox,\BoxNewXYoy,\BoxNewXYoz) -- (\BoxNewoYox,\BoxNewoYoy,\BoxNewoYoz) -- (0);
			%
			%\draw[tdplot_rotated_coords, orange] (\BoxNewooZx,\BoxNewooZy,\BoxNewooZz) -- (\BoxNewXoZx,\BoxNewXoZy,\BoxNewXoZz) -- (\BoxNewXYZx,\BoxNewXYZy,\BoxNewXYZz) -- (\BoxNewoYZx,\BoxNewoYZy,\BoxNewoYZz) -- (\BoxNewooZx,\BoxNewooZy,\BoxNewooZz);
			%
			%\draw[tdplot_rotated_coords, orange] (\BoxNewooZx,\BoxNewooZy,\BoxNewooZz) -- (0);
			%\draw[tdplot_rotated_coords, orange] (\BoxNewXoZx,\BoxNewXoZy,\BoxNewXoZz) -- (\BoxNewXoox,\BoxNewXooy,\BoxNewXooz);
			%\draw[tdplot_rotated_coords, orange] (\BoxNewXYZx,\BoxNewXYZy,\BoxNewXYZz) -- (\BoxNewXYox,\BoxNewXYoy,\BoxNewXYoz);
			%\draw[tdplot_rotated_coords, orange] (\BoxNewoYZx,\BoxNewoYZy,\BoxNewoYZz) -- (\BoxNewoYox,\BoxNewoYoy,\BoxNewoYoz);


			%\draw[tdplot_rotated_coords,green] (0) -- (BoxNewX00) -- (BoxNewXY0) -- (BoxNew0Y0) -- (0);
			%\draw[tdplot_rotated_coords, green] (BoxNew00Z) -- (BoxNewX0Z) -- (BoxNewXYZ) -- (BoxNew0YZ) -- (BoxNew00Z);

			%%%\foreach \stepNumber in {1,2,3}
			\foreach \slideNumber in {4,5,6}
			%%%\foreach \betaNextBox in {-15,-30,-45}
			{
				\pause
				%%%\pgfmathsetmacro{\betaNextBox}{(-15)*\stepNumber}
				\pgfmathsetmacro{\betaNextBox}{(-15)*(\slideNumber-3)}
				%%%\pgfmathsetmacro{\slideNumber}{3+\stepNumber}
				\only<\slideNumber>{
					% Rotating box around one new axis:
					% Create a new rotated system in the center.
					\tdplotsetrotatedcoords{\alphaNextBox}{\betaNextBox}{\gammaNextBox}

					%\draw[dashed,tdplot_rotated_coords,gray] (0,0,0) --  (1.3*\lenX,0,0) node[anchor=north east]{$x$};
					%\draw[dashed,tdplot_rotated_coords,gray] (0,0,0) -- (0,1.3*\lenY,0) node[anchor=south east]{$y$};
					%\draw[dashed,tdplot_rotated_coords,gray] (0,0,0) -- (0,0,1.3*\lenZ) node[anchor=north east]{$z$};


					% Draw a box in the  new coordinates system
					\draw[dashed,tdplot_rotated_coords, gray] (0) -- (\BoxNewXoox,\BoxNewXooy,\BoxNewXooz);
					\draw[tdplot_rotated_coords, gray] (\BoxNewXoox,\BoxNewXooy,\BoxNewXooz) -- (\BoxNewXYox,\BoxNewXYoy,\BoxNewXYoz) -- (\BoxNewoYox,\BoxNewoYoy,\BoxNewoYoz);
					\draw[dashed,tdplot_rotated_coords, gray] (\BoxNewXYox,\BoxNewXYoy,\BoxNewXYoz) -- (\BoxNewoYox,\BoxNewoYoy,\BoxNewoYoz) -- (0);

					\draw[tdplot_rotated_coords, gray] (\BoxNewooZx,\BoxNewooZy,\BoxNewooZz) -- (\BoxNewXoZx,\BoxNewXoZy,\BoxNewXoZz) -- (\BoxNewXYZx,\BoxNewXYZy,\BoxNewXYZz) -- (\BoxNewoYZx,\BoxNewoYZy,\BoxNewoYZz) -- (\BoxNewooZx,\BoxNewooZy,\BoxNewooZz);

					\draw[tdplot_rotated_coords, gray] (\BoxNewooZx,\BoxNewooZy,\BoxNewooZz) -- (0);
					\draw[tdplot_rotated_coords, gray] (\BoxNewXoZx,\BoxNewXoZy,\BoxNewXoZz) -- (\BoxNewXoox,\BoxNewXooy,\BoxNewXooz);
					\draw[tdplot_rotated_coords, gray] (\BoxNewXYZx,\BoxNewXYZy,\BoxNewXYZz) -- (\BoxNewXYox,\BoxNewXYoy,\BoxNewXYoz);
					\draw[tdplot_rotated_coords, gray] (\BoxNewoYZx,\BoxNewoYZy,\BoxNewoYZz) -- (\BoxNewoYox,\BoxNewoYoy,\BoxNewoYoz);

					\tdplotsetthetaplanecoords{0}
					\tdplotdrawarc[tdplot_rotated_coords,gray,thick,dotted,<->]{(0,0,0)}{\boxX}{90}{90+\betaNextBox}{anchor=west}{}
				}
			} % end \foreach

			\end{tikzpicture}
		\end{figure}
	\end{frame}


\end{document}